Chapter 00
What this report is, and what it cannot tell you
A field report for people who run a Shopify or DTC P&L through BFCM: what the 2025 season actually did, what the 2026 calendar changes, where the discount math breaks, and which of this year's circulating numbers survive a look at the primary source. Published by ShopX 2026.
This is a companion to the AI Commerce Field Report 2026, built from a different corpus and for a narrower reader: the operator who has to pick a discount, commit a purchase order, and sign off a freeze date, and who will be held to the margin afterwards.
How it was built
Checking changed the number as often as it confirmed it: a forecast circulating as an actual, a category figure quoted as a platform total, a relative move quoted as percentage points. Where the check produced a different number, the corrected one is the only one printed here. Chapter 12 collects the failures on purpose, because the patterns repeat.
Every number carries its measurer, period and population in the same sentence or the one next to it, and appears again in the evidence ledger in Chapter 14 with its status and a link.
What the sample is, and what it is not
The corpus is what practitioners published in public. That biases it in ways worth stating plainly before the first chart.
- It skews to people who post. Agencies, vendors, consultants and founders who market themselves are over-represented.
- It skews US and UK. Where a figure is UK, EU or global, this report says so: quoting a UK survey as if it were American is one of the recurring errors in the corpus.
- It is not a market model. Nothing here is a panel, a representative sample of merchants, or a forecast of your category. Adobe, Salesforce, Shopify, Klaviyo and Stripe each measure a different population, and their numbers are not additive.
- Self-reported results stay labelled. Where a person or agency reports their own outcome, the report names them and says it is self-reported and not independently verified. Those claims are never used to support a general conclusion.
- Vendor research carries the vendor's interest. A repricing company finds that retailers do not reprice; an incrementality company finds that platform reporting overstates. Both can be true and both are still marketing.
What it is good for is the thing a market model cannot give you: the sequence of decisions operators actually make between September and January, the arguments they are having about those decisions, and the failure modes they only describe afterwards.
How to read the labels
First-party / research means the number was confirmed in the measurer's own document. Named, secondhand means the measurer is named and the figure was confirmed through reputable reporting of that measurer, but their own page could not be fetched. Weak source means the caveat has to travel with the number: a different population than people assume, a stated intent rather than a measured behaviour, or a definition broader than the headline.
What to do about it
Read the population before the number
Every figure here names who measured it, over what period, among whom. If you are about to move budget on one, check that its population resembles your business before you check its size.
Take the corrections, not just the headlines
Several numbers in wide circulation are wrong in a specific, checkable way. Chapter 12 lists them and Chapter 14 links every source, so an internal deck can be cleaned up in an afternoon.
Use the chapter order as the plan order
Read last season honestly (01), fix the calendar (02), set the offer against contribution margin (03), then lock the store and the marketplace metrics (04). Doing them out of order is how a good offer meets a frozen storefront.
The short version of what follows: 2025's growth was mostly price, the calendar has moved earlier, the discount you are considering costs more contribution margin than its percentage suggests, and the largest measurable AI effect on your season is a small stream of high-intent traffic most stores cannot currently see in their own reporting. Each of those is a decision, and each has a chapter.
Chapter 01
Every tracker set a record, and Black Friday orders still fell
US shoppers spent $257.8 billion online over the 2025 holiday season and Shopify merchants took $14.6 billion over the BFCM weekend. On Black Friday itself, Salesforce counted about 1% fewer online orders than a year earlier at a 7% higher average selling price. Both halves are true. Only one of them made it into most of the recaps.
What holds up
- US online holiday spend was $257.8 billion, up 6.8% year over year, for Nov 1 to Dec 31 2025, above Adobe's own pre-season forecast of $253.4 billion (First-party / research Adobe Analytics, US online, full season · release).
- Shopify merchants did $14.6 billion globally over the BFCM weekend, up 27% (24% constant currency), with a peak of $5.1 million per minute at 12:01pm EST on Black Friday (First-party / research Shopify, global merchant sales, four-day weekend · release).
- On Black Friday, US online order volume fell about 1% year over year while average selling price rose 7% and units per transaction fell 2% (Named, secondhand Salesforce, US online, Black Friday 2025, via Retail Dive · report).
- Across all payment types and all channels, the US holiday season crossed $1 trillion for the first time, up 4.1%, measured on actual card transactions rather than survey (First-party / research CNBC/NRF Retail Monitor with Affinity Solutions, US, Nov 1 – Dec 31 2025 · release).
- The season flattened rather than sharpened: 25 days saw more than $4 billion of US online spend in 2025, against 18 days in 2024 (First-party / research Adobe Analytics, US online · release).
The scoreboard, with the scopes kept apart
Adobe Analytics measures US online spend across more than a trillion visits to US retail sites. On that basis the 2025 holiday season (Nov 1 to Dec 31) reached $257.8 billion, up 6.8%, beating Adobe's own October forecast of $253.4 billion and +5.3%. Growth came in below 2024's +8.6% but above what Adobe itself had expected.
Black Friday is one day inside a two-month season
US online spend, Nov 1 – Dec 31 2025. The windows are nested: Black Friday sits inside Cyber Week, which sits inside the season.
Show data table
| Full season (Nov 1 – Dec 31) | $257.8B |
| Cyber Week (Thanksgiving – Cyber Monday) | $44.2B |
| Cyber Monday | $14.25B |
| Black Friday | $11.8B |
Inside the season, Adobe put Cyber Week (Thanksgiving through Cyber Monday) at $44.2 billion, up 7.7%. Black Friday online was $11.8 billion, up 9.1% from $10.8 billion in 2024. Cyber Monday stayed the largest online day of the year at $14.25 billion, up 7.1% from $13.3 billion. All three of those growth rates are slower than the equivalent 2024 rates, which Adobe put at +10.2% for Black Friday, +7.3% for Cyber Monday and +8.2% for Cyber Week. That is the first sign the record dollars were doing less work than they appear to.
The all-channel trackers landed lower, as they always do, because stores are most of retail. The CNBC/NRF Retail Monitor, built on actual credit and debit transactions compiled by Affinity Solutions, measured US holiday retail up 4.1% and above $1 trillion for the first time. Visa's Retail Spend Monitor put the seven weeks from Nov 1 at +4.2%, not adjusted for inflation. Mastercard SpendingPulse measured Nov 1 to Dec 21 at +3.9%. On Black Friday itself, Mastercard had total US retail (excluding autos) up 4.1%, e-commerce up 10.4% and in-store up 1.7%.
Keep those scopes apart when you quote them, because the corpus does not. Adobe is US online only. Shopify is global merchant GMV. Mastercard and Visa are payment networks across all channels. Salesforce is its own commerce panel. None of them is a subset of another, and none of them is your category.
Shopify's weekend, and what the platform number includes
Shopify merchants' BFCM weekend, five years
Global merchant sales over the four-day BFCM weekend, POS included. Part of this curve is Shopify adding merchants, not the same stores selling more.
Show data table
| BFCM 2021 | $6.3B |
| BFCM 2022 | $7.5B |
| BFCM 2023 | $9.3B |
| BFCM 2024 | $11.5B |
| BFCM 2025 | $14.6B |
Shopify merchants generated $14.6 billion globally over the BFCM weekend, up 27% year over year and 24% on a constant-currency basis. The five-year series runs $6.3 billion (2021), $7.5 billion, $9.3 billion, $11.5 billion, $14.6 billion. Black Friday alone was $6.2 billion, up 25%, at an average cart of $117.93, against a weekend average cart of $114.70.
The operating detail is worth more than the headline. Shopify reported 81 million-plus shoppers over the weekend, 15,800 merchants making a first-ever sale, 94,900 having their best day ever, cross-border at 16% of orders, Shop Pay used on 32% of orders with its sales up 39%, and the peak minute of $5.1 million at 12:01pm EST on Black Friday.
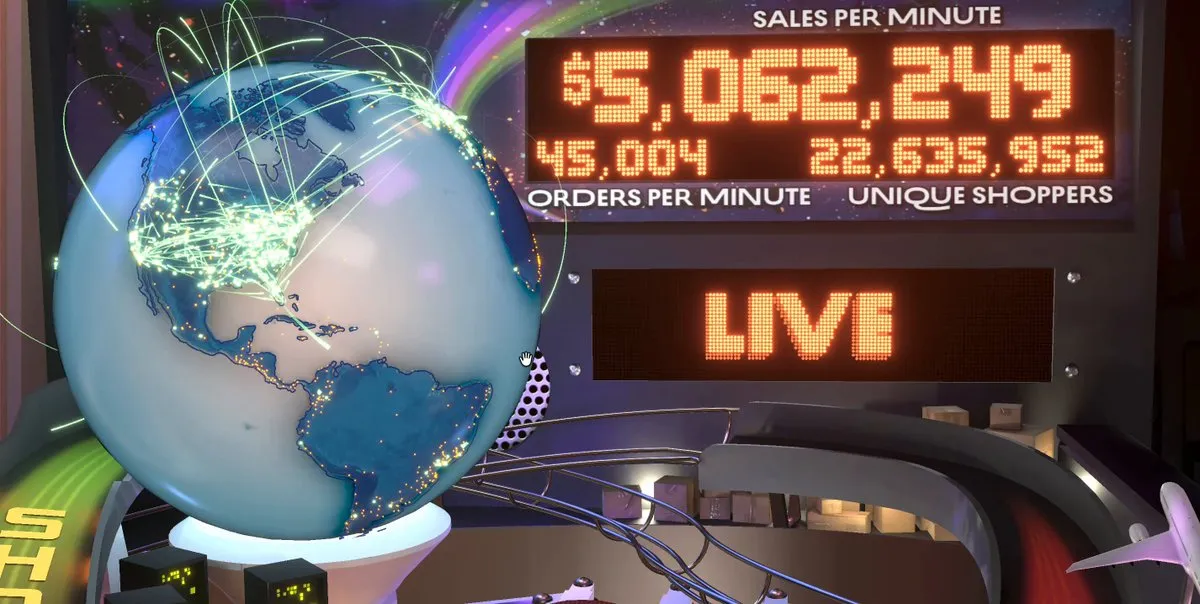
One caveat travels with the five-year line: platform GMV grows when Shopify adds merchants, not only when existing merchants grow. A 27% platform number is not a 27% same-store number, and it is not a benchmark for your store. Treat it as evidence about the platform, not about you.
The payment rails corroborate the scale from a third angle. Stripe reported more than $40 billion of payment volume across more than 578 million transactions from Black Friday through Cyber Monday, peaking above 152,000 transactions per minute, with Cyber Monday alone above $10 billion. That is Stripe's processed volume, not market size.
Where the growth actually came from
Record Black Friday dollars, fewer orders
Year-on-year change, US online, Black Friday 2025. Spend rose because the average item cost more, not because more people bought.
Show data table
| Average selling price | 7% |
| Online order volume | -1% |
| Units per transaction | -2% |
Salesforce's read of Black Friday is the number that reframes the season. US online order volume fell about 1% year over year, average selling price rose 7%, and units per transaction fell 2%. The figures come from Salesforce's director of consumer insights, Caila Schwartz, reported verbatim across several trade outlets; Salesforce did not publish a standalone release carrying that day-level cut, so treat it as named and secondhand rather than fetched from the measurer's own page.
Salesforce's published Cyber Week figure is adjacent but not identical: average selling price up 6% year over year, given as one global number. Its pre-season analysis of Oct 1 to Nov 15 had prices up 7% in the US and 5% globally. That US-versus-global split is the origin of a widely repeated claim that Cyber Week prices rose 5% in 2024 and 7% in 2025. Salesforce published no 2024 Cyber Week ASP figure at all, so that year-over-year comparison cannot be constructed from its own releases. It is a misreading of a geographic split.
When record spending comes with falling order volumes and fewer items per transaction, that's inflation masquerading as growth.
Hedgie (@HedgieMarkets), markets commentator
The consumer backdrop was consistent with that. The Conference Board's Consumer Confidence Index fell 6.8 points to 88.7 in November 2025, with the Expectations Index down 8.6 points to 63.2. Note the exact claim: the Conference Board said the index had fallen to its lowest level since April, which is not the same as the drop being the largest since April. The stronger version circulated widely and is not what the measurer said.
Credit filled some of the gap. Buy Now, Pay Later reached $20.0 billion of US online holiday spend, up 9.8%, and crossed $1 billion in a single day for the first time on Cyber Monday at $1.03 billion. Black Friday BNPL came in at $747.5 million, about 6.3% of Black Friday digital sales. The $761.8 million figure that circulates for Black Friday was Adobe's pre-season forecast, not the result. It is the cleanest small example in this report of a forecast being quoted as an actual.
Mobile took 56.4% of US online holiday transactions across the season, rising to 66.5% on Christmas Day. If your own November traffic is majority mobile and your conversion gap between mobile and desktop is wide, that gap is now where most of the season lives.
What operators measured on their own accounts
Northbeam's recap of Cyber Week 2025 across its customer base reported ad spend up just over 9% year over year, revenue up more than 13%, first-time customer acquisition cost up about 8%, and media efficiency ratio improved. Two cautions: Northbeam does not disclose the sample beyond "thousands of DTC brands," and the two-decimal versions of those figures that circulate, including a specific MER number, do not appear in Northbeam's own article, which describes MER only as improved. Use the direction, not the decimals.
US online holiday spend, Nov 1 – Dec 31 2025, up 6.8% and above Adobe's own $253.4B forecast.
First-party / research Adobe Analytics · release
US online order volume and average selling price on Black Friday 2025, year over year. Units per transaction fell 2%.
Named, secondhand Salesforce via Retail Dive · report
Shopify merchant sales over the BFCM weekend, up 27% (24% constant currency). Platform total, not same-store.
First-party / research Shopify · release
Days above $4B of US online spend in the 2025 season, against 18 in 2024. The peak spread out.
First-party / research Adobe Analytics · release
Operator note
If your 2025 revenue grew but your order count did not, you had the same season the market had. That is not a failure, but it changes the 2026 plan: a price-led year repeats only if you can hold price again, and a shopper who bought fewer units at a higher price is one markdown away from buying the same units somewhere cheaper.
What to do about it
Re-run last season in units, not dollars
Pull orders, units per order and average selling price for Nov 1 to Dec 31, 2025 against 2024. If dollars grew and units did not, your 2025 was price, and your 2026 forecast needs to say where the next price increase comes from.
Deflate your own year-over-year line
Bain puts headline inflation at 3.4% for the 2026 season, more than half of the growth it forecasts. Show the board a real-terms line next to the nominal one before you set a growth target off the nominal one.
Pick one external tracker and stay with it
Choose the one whose population is closest to yours, write down what it measures, and compare to it all season. Mixing Adobe, Shopify, Salesforce and Mastercard inside one deck produces a story, not a read.
Check the mobile gap before October
Mobile was 56.4% of US online holiday transactions. Measure your own mobile conversion against desktop on your top five landing pages now, while a theme change is still allowed (Chapter 04).
Decide your BNPL position deliberately
BNPL was $20 billion of the US online season and set a single-day record on Cyber Monday. Whether you offer it, and at what ticket, is an offer decision with a fee attached, not a checkout afterthought.
Chapter 02
Black Friday 2026 is November 27, and most of the deciding happens before it
Cyber Monday falls on November 30, back inside November for the first time since 2023. McKinsey puts the share of US shoppers who plan to start by the end of October at 45%; two separate surveys put the share who plan to start on Black Friday weekend at 12% and 19%. The weekend is where the money lands. It is no longer where the choice is made.
What holds up
- Black Friday 2026 is Friday November 27 and Cyber Monday is Monday November 30, the first November Cyber Monday since 2023. Christmas Eve falls on a Thursday (First-party / research direct calendar computation · reference).
- 45% of US consumers plan to have started holiday shopping by the end of October; 24% plan to start in November before Black Friday; 12% plan to start on Black Friday weekend. Stated intent, not measured behaviour (Named, secondhand McKinsey ConsumerWise, n>4,000 US consumers, fielded Jul 29 – Aug 5 2026 · report).
- 24% of online shoppers expect to begin their holiday journey on a generative-AI platform, up from 17% in 2025, with a further 13% planning to use a retailer's own AI agent. More than 90% still plan to shop Black Friday, Cyber Monday or another major sale event (First-party / research Bain & Company Consumer Lab Holiday Survey 2026, US n=1,105 · infographic).
- Bain forecasts US November–December retail of $1,016 billion, up 4.5%, with headline inflation of 3.4% accounting for more than half of that growth; in-store +2.5%, online +9% (First-party / research Bain & Company, US, Nov–Dec 2026 · infographic).
- 54% of US consumers say it is not critical to shop Black Friday and Cyber Monday specifically because deals run all season, while 56% still plan to participate (First-party / research Basis Technologies with GWI, n=2,006 US consumers 16+, fielded May 2026 · release).
The calendar gives you four extra days, then takes them back
Thanksgiving 2026 is November 26, Black Friday is November 27, and Cyber Monday is November 30. Cyber Monday last fell in November in 2023; it landed in December in both 2024 and 2025. The practical consequence is a longer December run to the Christmas shipping cutoffs, with Christmas Eve on a Thursday, which gives most carriers an extra midweek working day at the end.
It also means the promotional gap between Cyber Monday and the first December deadline is wider than the last two years, and that gap is where discount-conditioned shoppers wait. Chapter 03 deals with what that waiting costs.
Where the deciding happens
When US shoppers say they will start, 2026
Stated intent, not observed behaviour. 45% start by the end of October; the rest start in December or sit the season out.
Show data table
| Already started (before August) | 10% |
| August | 5% |
| September | 11% |
| October | 19% |
| November, before Black Friday | 24% |
| Black Friday weekend | 12% |
McKinsey's ConsumerWise survey, fielded on more than 4,000 US consumers between July 29 and August 5, 2026, breaks the start of the season down: 10% had already started, 5% in August, 11% in September and 19% in October, which is 45% by the end of October. November before Black Friday is the single most common answer at 24%. Black Friday weekend itself is 12%.
Cordial's survey of 1,000 US consumers lands in the same place from a different sample: 19% say they will start on Black Friday weekend, and 53% say promotions that start in October or early November make them more likely to engage with that brand's messages. Cordial is a vendor publishing its own consumer research and does not disclose its panel or fielding month, so read it as corroboration of direction, not as a second measurement.
Two cautions before you move budget on this. First, all of it is stated intent. People are describing plans in July and August for a season in November. Second, intent to start is not intent to buy. Several operators in the corpus describe 2025 shoppers building carts in early November and waiting for the final offer, which looks like early demand in the analytics and converts on the weekend anyway.
Black Friday is becoming a closing event, not a discovery event.
Jacek Materna, CEO, TrueLoyal
The counter-case is worth holding in the same hand. Bain finds more than 90% of shoppers still plan to buy on one of the big sale days. Basis finds 56% still plan to participate even as 54% say the specific window is not critical. Shopify's peak minute in 2025 was noon on Black Friday.
Consumers already told us when they want to shop. It's called Black Friday for a reason.
Jimmy Kim, four-time founder, co-host of the Send It podcast
Both readings survive the evidence because they answer different questions. Attention and consideration have moved into October and early November. Transactions have not moved much at all. The plan that follows from this is not "move the sale earlier"; it is "be present and legible in October, and keep the conversion event where the shopper expects it."
The shape of 2026 demand
Forecasts agree on direction and differ on window. Bain puts US November–December retail over $1 trillion for the first time, at $1,016 billion and +4.5%, with in-store +2.5% and online +9%; because online is about a third of the total, that split implies online contributes roughly 60% of the dollar growth, which is arithmetic on Bain's numbers rather than a figure Bain prints. Bain also says headline inflation of 3.4% accounts for more than half of the growth.
Deloitte, measuring a longer window of November 2026 through January 2027, forecasts total holiday retail of $1.70–1.71 trillion (+4.0% to +4.8%) and e-commerce of $316.1–318.9 billion (+7.5% to +8.4%). EMARKETER's February model puts US holiday online growth at about 6.6% against roughly 2.6% for total US retail, and describes 2026 as similar to 2025 rather than accelerating. Those three are not in conflict; they cover different windows and different definitions of retail.
The consumer side is softer than the totals suggest. PwC's twelfth annual Holiday Outlook, a US survey of 4,093 people fielded June 15–26 2026, found average planned gift spend down about 2% to $708, with Millennials planning 10% less on gifts and 37% less on travel, and 60% of consumers planning to buy gifts in physical stores. McKinsey's same August survey found 47% planning to spend about the same, 23% more and 21% less.
"Shoppers will use AI": nine surveys, nine different questions
Every row is a real published figure. The spread comes from who was asked and from what counts as "using AI" — not from behaviour changing that fast. The two muted rows only surveyed people who already use AI.
Show data table
| Zeta · will let AI pick gifts — base: US adults who use AI weekly (n=2,000) | 83% |
| PayPal/Talker · will use AI as a shopping assistant — base: already used or considered AI (n=1,000) | 77% |
| Narvar · AI for at least one part of holiday shopping — US shoppers (n=1,348) | 65% |
| Google/Ipsos · used AI during the 2025 journey — US holiday shoppers | 61% |
| Klaviyo · will use an AI shopping assistant for BFCM — US/UK/AU (n=3,000) | 56% |
| Visa/Morning Consult · already used AI for a shopping task — US adults (n=1,000) | 47% |
| McKinsey · probably/definitely will use AI tools — US consumers (n>4,000) | 46% |
| PwC · plan to use AI somewhere in holiday shopping — US consumers (n=4,093) | 29% |
| Bain · plan to START on a gen-AI platform — US online shoppers (n=1,105) | 24% |
So: a record-dollar season, growing at roughly the rate of inflation plus a little, in which about one shopper in five intends to spend less and the online share does most of the growing.
Two dates that are not on the retail calendar
The US midterm elections fall on November 3, 2026, exactly 24 days before Black Friday. AdImpact's June 2026 projection puts total 2026 election-cycle ad spending at $11.6 billion. That money buys the same inventory you buy, in the same weeks you plan to warm audiences, and it does not bid rationally against a retail ROAS target. If you run any CTV or local video, price that pressure into October rather than discovering it in November.
Amazon's event is the second date. In both 2024 and 2025 Amazon's combined Black Friday Week and Cyber Monday promotion ran about 12 days, ending on Cyber Monday. Amazon has not published 2026 dates, so do not print specific ones in your plan; assume a roughly two-week Amazon event ending November 30 and decide deliberately whether your own sale opens before it or inside it.
One more cost curve to plan against: Strike Social's ad-cost analysis puts Halloween-week media at 15% to 34% cheaper than the Black Friday-to-Cyber Monday window, and places the most expensive days of the year 7 to 10 days before Christmas Eve. That is one vendor's aggregated buying data rather than a market constant, but the shape matches what every operator in the corpus describes.
Handle with care
"X% of shoppers will use AI this holiday" is the least comparable statistic in this report. Across the surveys checked it ranges from 13% to 77%, because each asks a different question of a different population: delegating to a retailer's agent (Bain, 13%), starting discovery on a generative-AI platform (Bain, 24%), planning to use AI to research or budget (PwC, 29%), probably or definitely using AI tools (McKinsey, 46%), using AI for at least one part of holiday shopping (Narvar, 65%). One widely quoted 15% figure is a UK survey. Never quote a single AI-adoption number without the surveyor and the exact question.
US consumers planning to start holiday shopping by end of October, against those planning to start on Black Friday weekend. Stated intent, Aug 2026.
Named, secondhand McKinsey ConsumerWise, n>4,000 · report
Online shoppers planning to start on a generative-AI platform (up from 17% in 2025), plus a further 13% planning to use a retailer's own AI agent.
First-party / research Bain & Company, US n=1,105 · infographic
Headline inflation inside Bain's +4.5% US holiday forecast, accounting for more than half of the projected growth.
First-party / research Bain & Company, US Nov–Dec 2026 · infographic
Between US Election Day (Nov 3) and Black Friday (Nov 27), against an $11.6 billion projected political ad cycle.
Named, secondhand AdImpact, June 2026 projection · source
What to do about it
Write the three dates on one page
November 27, November 30, and your own lock date in mid-October (Chapter 04). Everything else in the plan is scheduled backwards from those three, including creative production and paid-media learning phases.
Be present in October without discounting in October
Gift guides, collection pages, comparison content and email re-engagement belong in the window where 45% of shoppers say they start. The discount does not have to move with them.
Buy demand before the political money lands
Seed top-of-funnel in the Halloween window, where Strike Social measures media at 15–34% below the BFCM window, and accept lower in-window ROAS for it.
Decide your position against Amazon's event, then write it down
Amazon has run roughly 12 days ending on Cyber Monday for two years and has not announced 2026. Choose to open before it or inside it, and give the reason in one sentence in the plan.
Stop quoting a single AI-adoption number
If an AI figure appears in your internal deck, write the surveyor, the question and the population next to it, or delete it. The spread across surveys is 13% to 77% and nearly all of it is wording.
Plan December for a Thursday Christmas Eve
Cyber Monday in November plus a Thursday Christmas Eve means a longer December selling window and one more midweek shipping day. Publish your cutoff dates against that calendar early and hold them.
Chapter 03
A 15% discount does not cost you 15%
On a business with a 60% contribution margin, 15% off removes a quarter of the contribution, 25% off removes about 42%, and a blanket 40% off needs three times the orders to stand still. Meanwhile the average BFCM discount in Klaviyo's customer base went down, not up. The edge in 2026 is in offer design, not in depth.
What holds up
- Average BFCM discount depth across Klaviyo's brands fell from 29.1% in 2024 to 26.2% in 2025, a 10% relative decline, not a 10-point one. This is Klaviyo's SMB and DTC customer base, not US retail (Weak source Klaviyo 2025 BFCM Recap, own customer base · report).
- On €100 of revenue with a €60 contribution margin, 15% off cuts contribution 25%, 20% off cuts it 33%, and 25% off cuts it roughly 42% (First-party / research recomputed arithmetic on the worked example).
- The volume you need to stand still is margin ÷ (margin − discount). At 60% margin that is 2× orders at 30% off and 3× at 40% off, so the common "at least double" rule is wrong at the top of its own range (First-party / research recomputed break-even arithmetic).
- Free shipping (61%) beats a bigger discount (45%) as a stated reason for choosing where to buy this season (Weak source Cordial Holiday 2026 Consumer Research, n=1,000 US consumers, stated intent · report).
- 70% of US holiday shoppers say they would forgo a 5% discount for a guaranteed delivery date, up from 66% in 2025; 54% would give up 10% and 37% would give up 20% for the same guarantee (Named, secondhand Radial with Dynata, ~1,000 US adults, fielded Aug 2026 · release).
The arithmetic nobody runs before the meeting
What a discount costs in volume: the multiple you need just to stand still
Volume multiple = margin ÷ (margin − discount). Assumes unit cost unchanged, the discount taken straight off price, and returns and acquisition cost unchanged. At a 40% margin, a 40% discount can never be earned back on volume at all.
Show data table
| 60% contribution margin | 50% contribution margin | |
|---|---|---|
| 10% off | 1.2× | 1.25× |
| 20% off | 1.5× | 1.67× |
| 30% off | 2× | 2.5× |
| 40% off | 3× | 5× |
Start from the only example in this report that needs no source: €100 of revenue, €40 of variable cost, €60 of contribution margin. A price discount comes off revenue. Cost does not move. So 15% off leaves €85 of revenue and €45 of contribution, which is 25% less contribution for 15% less price. 20% off leaves €40, down a third. 25% off leaves €35, down about 42%.
If you offer a 15% discount, your contribution margin does not decrease by just 15%.
Ruben Runneboom, co-founder, Taskforce Performance Marketing
The second half of the calculation is the one that gets skipped. To hold the same gross profit you need more orders, and the multiple is margin ÷ (margin − discount). At a 60% contribution margin:
| Discount off price | Contribution margin left (from €60) | Contribution lost | Orders needed to stand still |
|---|---|---|---|
| 15% | €45 | −25% | 1.3× |
| 20% | €40 | −33% | 1.5× |
| 25% | €35 | −42% | 1.7× |
| 30% | €30 | −50% | 2.0× |
| 40% | €20 | −67% | 3.0× |
The rows are arithmetic on one stated margin, recomputed for this report; the 15%, 20% and 25% rows are the ones verified against the worked example in the ledger, and the volume column uses the break-even rule above. Run it again with your own contribution margin before you use it, because the multiple moves fast: at a 45% margin, 30% off already needs 3× the orders.
This matters because the widely repeated practitioner rule is that a 30–40% sitewide sale needs "at least double" the volume. That is exactly right at 30% off and a 60% margin, and it understates the requirement by half at 40% off. If the rule appears in your plan, check which end of the range your actual discount sits on.
Revenue is the scoreboard everyone sees. Contribution margin tells you whether you actually won.
Gleb Makagon, commercial sales manager, Triple Whale
And the stated discount is rarely the real one. Free shipping, a gift with purchase, loyalty points, elevated peak CAC and peak fulfilment costs all land in the same contribution line. A 30% sitewide offer with free shipping and a gift is not a 30% offer.
Depth is falling in one population and rising in another
Klaviyo brands discounted less in 2025, not more
Average discount across BFCM sends from ecommerce brands using Klaviyo — SMB and DTC, not large retailers. Down 2.9 points, a 10% relative fall.
Show data table
| BFCM 2024 | 29.1% |
| BFCM 2025 | 26.2% |
Klaviyo's 2025 BFCM recap puts average discount depth across its customer base at 26.2%, down from 29.1% in 2024. Read the change correctly: that is a 10% relative decline, or 2.9 percentage points. The corpus contains both readings and they are not the same claim.
The population matters more than the number. Klaviyo measures brands that send email and SMS through Klaviyo, which skews SMB and DTC. Adobe, measuring across large US retailers' catalogues, described 2025 discounts off list price as deeper than 2024. Both can be true at once, because they are different merchants measured with different instruments. Do not stage them as a contradiction, and do not take either as the benchmark for your category.
What the two together suggest is a split market: large retailers competing on depth off list, and smaller brands quietly stepping back from it. If you are in the second group, your 2026 question is not how deep to go. It is what you offer instead.
What shoppers say they want instead of depth
Cordial's survey of 1,000 US consumers has free shipping as the top reason for choosing where to buy this season at 61%, ahead of a bigger discount at 45%. A generational breakdown of that figure circulates widely (75% of Boomers down to 44% of Gen Z) and could not be found in Cordial's report or anywhere else, so it is not printed here.
Radial's annual peak-season survey, fielded with Dynata on about 1,000 US adults in August 2026, is the sharper version of the same trade-off: 70% would forgo a 5% discount for a guaranteed delivery date, up from 66% in 2025. At 10% off, 54% would still trade it away. At 20% off, 37% would. That is a priced curve, not a slogan: certainty is worth somewhere between 10 and 20 points of discount to roughly half of shoppers, which is more than most brands spend on making the promise deliverable.
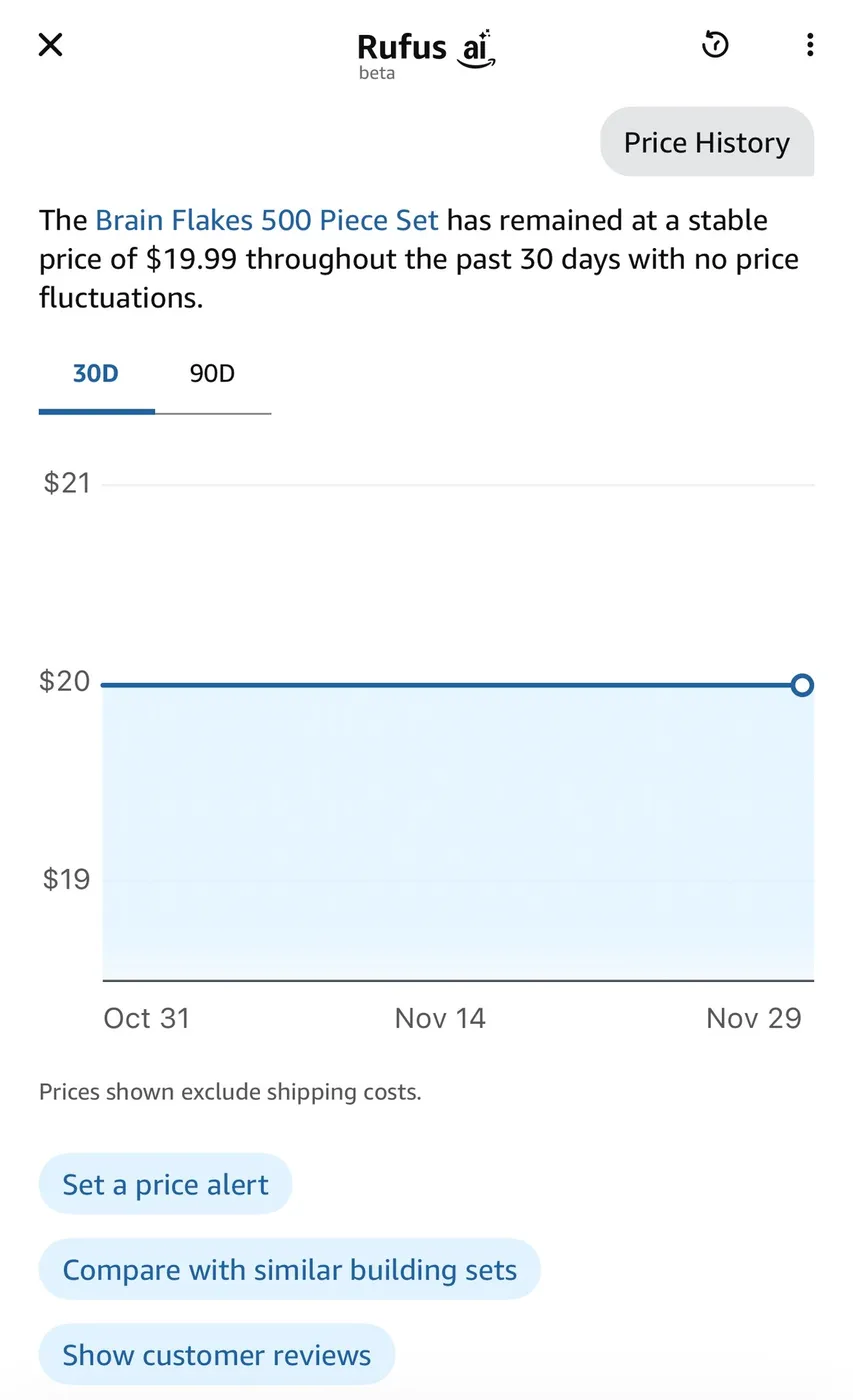
The other constraint on depth is that the anchor is now checkable. Amazon's Rufus assistant will show a shopper a 30-day price history on request. Price-tracking tools and AI assistants both make a fake "was" price a durable trust problem rather than a weekend tactic. If your strike-through price did not exist for a meaningful period, assume someone can show that it did not.
Structure beats depth
The alternatives to a deeper percentage are well catalogued by the operators in this corpus, and all of them protect contribution better than a sitewide cut: VIP or early access in the days before the public sale; tiered spend thresholds; buy-one-get-one, which holds average order value where a straight percentage halves it; a gift with purchase set just above current AOV; store credit redeemable in January, which moves the cost into a quieter month and buys a second visit; and ring-fencing your highest-margin hero SKUs at full price while the deep cuts do their real job of clearing dead stock.
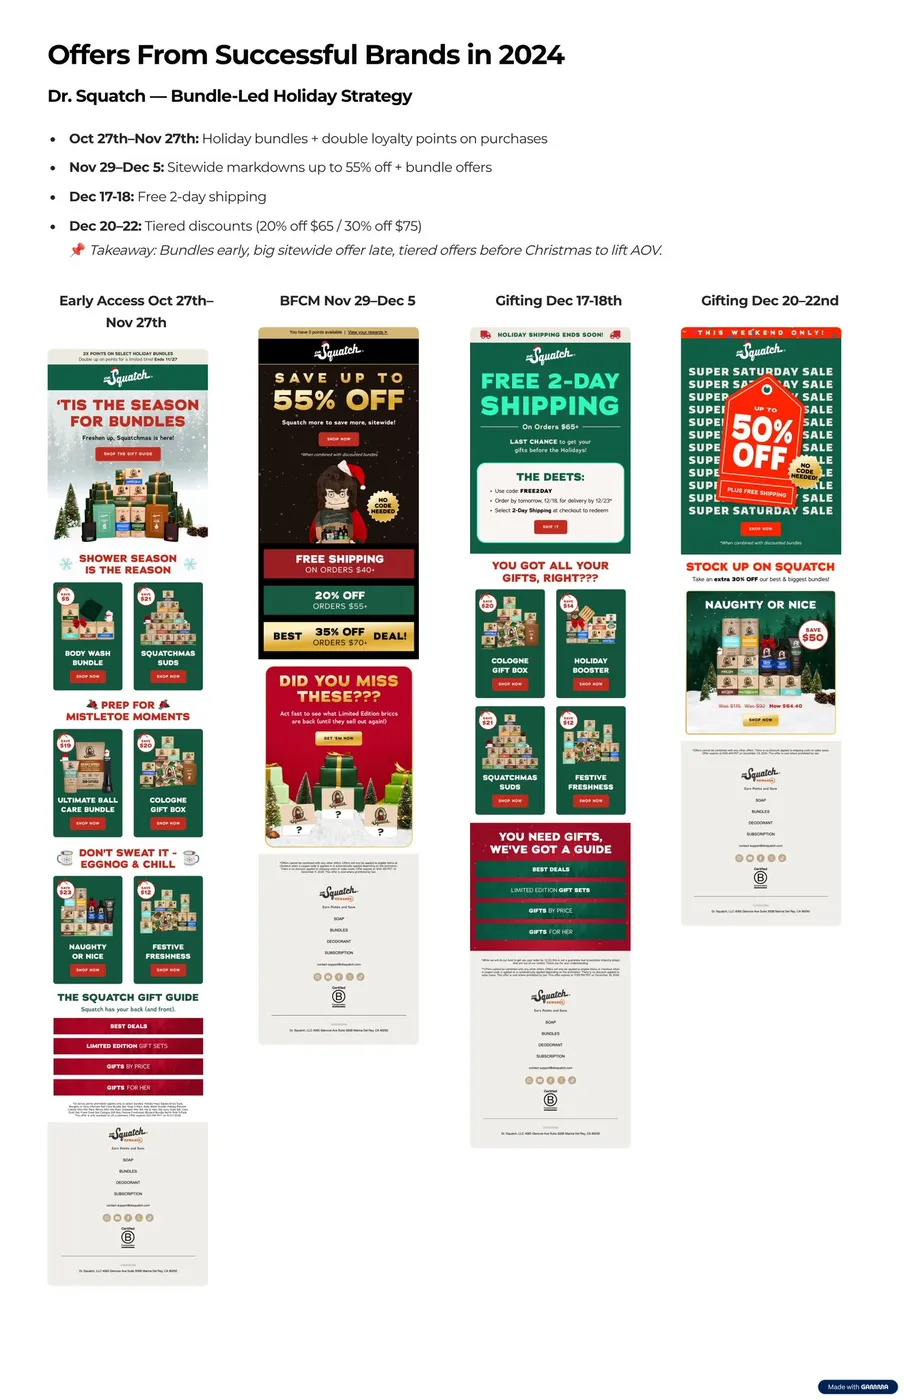
A three-stage structure recurs across the playbook posts: early access for the list, a loud Black Friday, then a Cyber Monday with a different angle such as a bundle or a bonus gift rather than a deeper number. The discipline that goes with it is to decide the whole sequence before it starts, because changing the offer midway means rewriting banners, landing pages, flows and paid creative in the week you have the least time.
Two operational failures show up often enough to be worth naming. The first is the evergreen 10%-off popup still running during a 25% sitewide sale, teaching your best traffic to hunt for a code. The second is the discount that never applies. Israa A., an email deliverability consultant, describes exactly that on a client account: the shipping settings did not align with the discount app, so the code never took effect at checkout. That account is self-reported and not independently verified, but the failure mode is cheap to rule out. Both are found by placing a real order on a real device before the sale, not by reading the settings screen.
Every time you run 30% off, you're training your customers to wait.
Nick Shackelford, CPG operator
The week you cannot react
Reprice's survey of 180 European e-commerce pricing leaders found that 30% changed no prices at all during Black Friday week, and 67% changed prices at most twice across the whole week. 74% said they hit a real barrier when they tried to react to competitors mid-week. The vendor sells repricing software, so the framing serves it; the underlying finding still matches what operators describe, which is that the price you set in October is effectively the price you trade on, whatever the plan said.
Contribution margin lost to a 25% discount on a 60%-margin product. Arithmetic, not a benchmark.
First-party / research recomputed worked example
Orders needed to hold gross profit at 30% and 40% off, at a 60% contribution margin.
First-party / research recomputed break-even rule
Average BFCM 2025 discount across Klaviyo's brands, down from 29.1% in 2024. SMB/DTC senders, not US retail.
Weak source Klaviyo 2025 BFCM Recap · report
US holiday shoppers who would give up a 5% discount for a guaranteed delivery date, up from 66% in 2025.
Named, secondhand Radial with Dynata, ~1,000 US adults · release
Operator note
The discount decision is also a customer-selection decision. A sitewide percentage buys the shopper who was going to buy anyway, at a lower price, and teaches your paid algorithms to find more people like them. Before you set the number, decide which of your SKUs stays profitable under it, and cap the rest.
What to do about it
Build the table with your own margin before you pick a number
Contribution margin, discount, contribution left, orders needed to stand still. If the required volume multiple is not achievable with your stock and your traffic, the discount is not affordable, whatever the competitor is doing.
Price the full stack, not the headline percentage
Add free shipping, gift with purchase, loyalty accrual, peak CAC and peak fulfilment to the discount before you approve it. Report the season on contribution, not revenue.
Spend the money on certainty instead of depth
Half of shoppers would trade 10% off for a guaranteed date. A delivery promise you can actually keep is cheaper than the ten points, and it survives into January as a returning customer.
Ring-fence the heroes, and aim the deep cuts at dead stock
Your top SKUs sell at full price in the highest-intent week of the year. Subsidising them is the most expensive line in most BFCM P&Ls.
Place a test order on the live site before launch
Real device, real payment method, real discount code, real shipping rate. This is where the discount-app and shipping-settings failure is found, and it takes twenty minutes.
Decide your mid-week price rule in advance
Write down the two conditions under which you would change price during the week and who approves it. Most teams change nothing all week because nobody agreed beforehand who was allowed to.
Chapter 04
The lock date is in mid-October, and the marketplaces set theirs even earlier
Two of the numbers that decide your BFCM are already live. TikTok Shop's US fulfilment thresholds took effect on September 3, 2026, and Amazon's Business Hour Delivery Rate requirement starts on September 30. Neither is a best practice. They are on/off switches on your promotion, measured on a rolling window that is running right now.
What holds up
- TikTok Shop's US Fulfillment Policy, effective September 3 2026, requires Valid Tracking Rate ≥95%, On-Time Delivery Rate ≥80%, Late Dispatch Rate at a recommended 4% with enforcement above 10%, and Seller-Fault Cancellation Rate ≤2.5% (First-party / research TikTok Shop Seller Center, US policy page · policy).
- From September 30 2026, US seller-fulfilled offers to Amazon Business customers must hold a Business Hour Delivery Rate of 90% or higher on a rolling 14-day window; offers can be deactivated for Business customers if the rate is still below 90% on October 30. FBA is not affected (First-party / research Amazon Seller Central announcement · announcement).
- Flat-average forecasting under-orders peak by more than half: 100 units a week over eight weeks is 800 units, while weighting four peak weeks at 3× and adding 20% growth is 1,920 (First-party / research recomputed from the stated worked example).
- Disclosing low product availability raised long-run order frequency 5.7% and spending 5.8%, and cut refunds 3.7% and replacements 2.9%, in a field experiment on more than 840,000 Instacart customers. The 2.6% refund figure in circulation is wrong (First-party / research Knight & Mitrofanov, Management Science · paper).
- Amazon's combined Black Friday Week and Cyber Monday event ran about 12 days in both 2024 and 2025. Amazon has published no 2026 dates, so do not plan against specific ones (Named, secondhand trade coverage of Amazon's announced 2024 and 2025 dates · report).
Why the freeze is a date and not a feeling
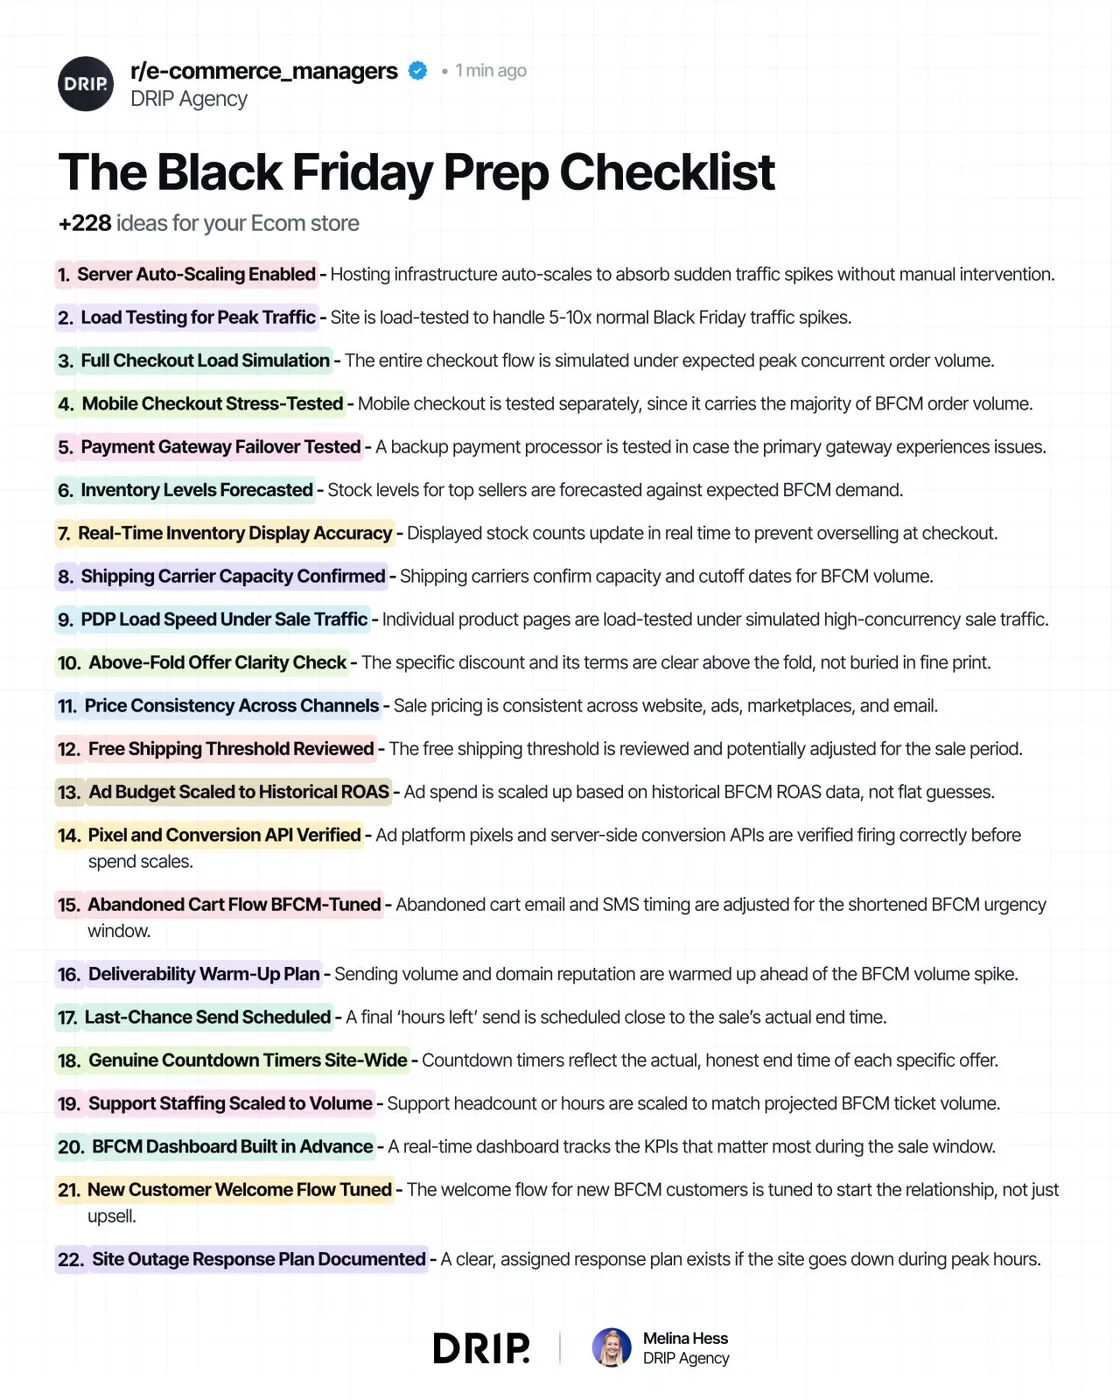
The consensus across the operators in this corpus is narrow and unusually specific: structural storefront work (theme changes, app installs, speed fixes, anything touching checkout) finishes by mid-October. October is merchandising. November is trading.
October is for merchandising. November is for trading. Peak is not for debugging.
Shoplane, Shopify partner, Australia
The reason is arithmetic rather than superstition. A theme change needs a quiet week to be tested on real devices; a payment change needs a real transaction on each method; an app install needs a before-and-after measurement on a throttled mobile connection. None of those weeks exist after the first week of November, when your traffic is the most expensive it will be all year.
Peak doesn't create the problems; it exposes the ones that have been costing you all year, then charges you for it over a single weekend.
Mat O'Connor, ecommerce consultant
A widely shared version of this argument comes with a precise before-and-after for load time and conversion rate after three "must-have" BFCM apps were installed. Those figures could not be traced to any account with a stated method, so they are not printed here. The advice that travels with them, which is to install no new apps inside 30 days of BFCM, costs nothing to follow and does not depend on the numbers being right.
Two things the freeze conversation usually misses. First, systems of record freeze but integrations do not: the failures land between the storefront, the ERP, the 3PL and the order-routing layer, so the thing to stress-test is order-to-cash and inventory sync, not just the theme. Second, a freeze on changes is not a freeze on verification. The weeks after the lock date are for placing test orders, throttling the network, checking the stock feed under load, and testing on-site search with the queries your gift guides will create.
Nobody makes significant changes to their systems in November.
Jan Arendtsz, CEO and founder, Celigo
The marketplace thresholds are the hard deadline
The operating thresholds that can switch your promotion off
Marketplace rules in force before BFCM 2026. The first three are floors you must stay above; the last two are ceilings you must stay under.
Show data table
| TikTok Shop · valid tracking rate (floor) | 95% |
| Amazon · business hour delivery rate, rolling 14 days (floor) | 90% |
| TikTok Shop · on-time delivery rate, weekly (floor) | 80% |
| TikTok Shop · late dispatch rate (ceiling) | 4% |
| TikTok Shop · seller-fault cancellation rate (ceiling) | 2.5% |
TikTok Shop's US Fulfillment Policy took effect on September 3, 2026. It sets four rates: Valid Tracking Rate at 95% or above, On-Time Delivery Rate at 80% or above measured weekly, Late Dispatch Rate with 4% recommended and enforcement triggering above 10%, and Seller-Fault Cancellation Rate at 2.5% or below. The service levels behind them are as concrete: regular orders dispatched within 2 business days of moving to Awaiting Shipment, auto-cancelled if no tracking appears within 5 business days, and delivered within 6.
One wrinkle to cite carefully. TikTok's separate Campaign FAQ page reportedly still lists a 5.0% bar for seller-fault cancellations against 2.5% in the Fulfillment Policy. When you quote a threshold internally, name the Fulfillment Policy specifically rather than "TikTok's rules," because two TikTok surfaces do not agree.
These four numbers are the on/off switch for BFCM coupons, direct discounts, and traffic support.
Fernando Campos, CEO, HiveHQ
Amazon's requirement runs on a similar clock from the other direction. From September 30, 2026, US seller-fulfilled offers to Amazon Business customers must maintain a Business Hour Delivery Rate of at least 90% across a rolling 14-day window. Sellers below the bar get a notification on September 30; if the rate is still under 90% by October 30, FBM offers can be deactivated for Business customers. FBA offers and retail-offer eligibility are not affected.
Read the dates together and the planning consequence is obvious. A rolling 14-day window assessed on September 30 is measuring shipments you are making now. A weekly on-time delivery rate that gates campaign support in late November is built from October's performance. By the time the promotion is live, the eligibility question has already been answered by carrier choices made six to eight weeks earlier.
Inventory is the ceiling, and the forecast is usually flat
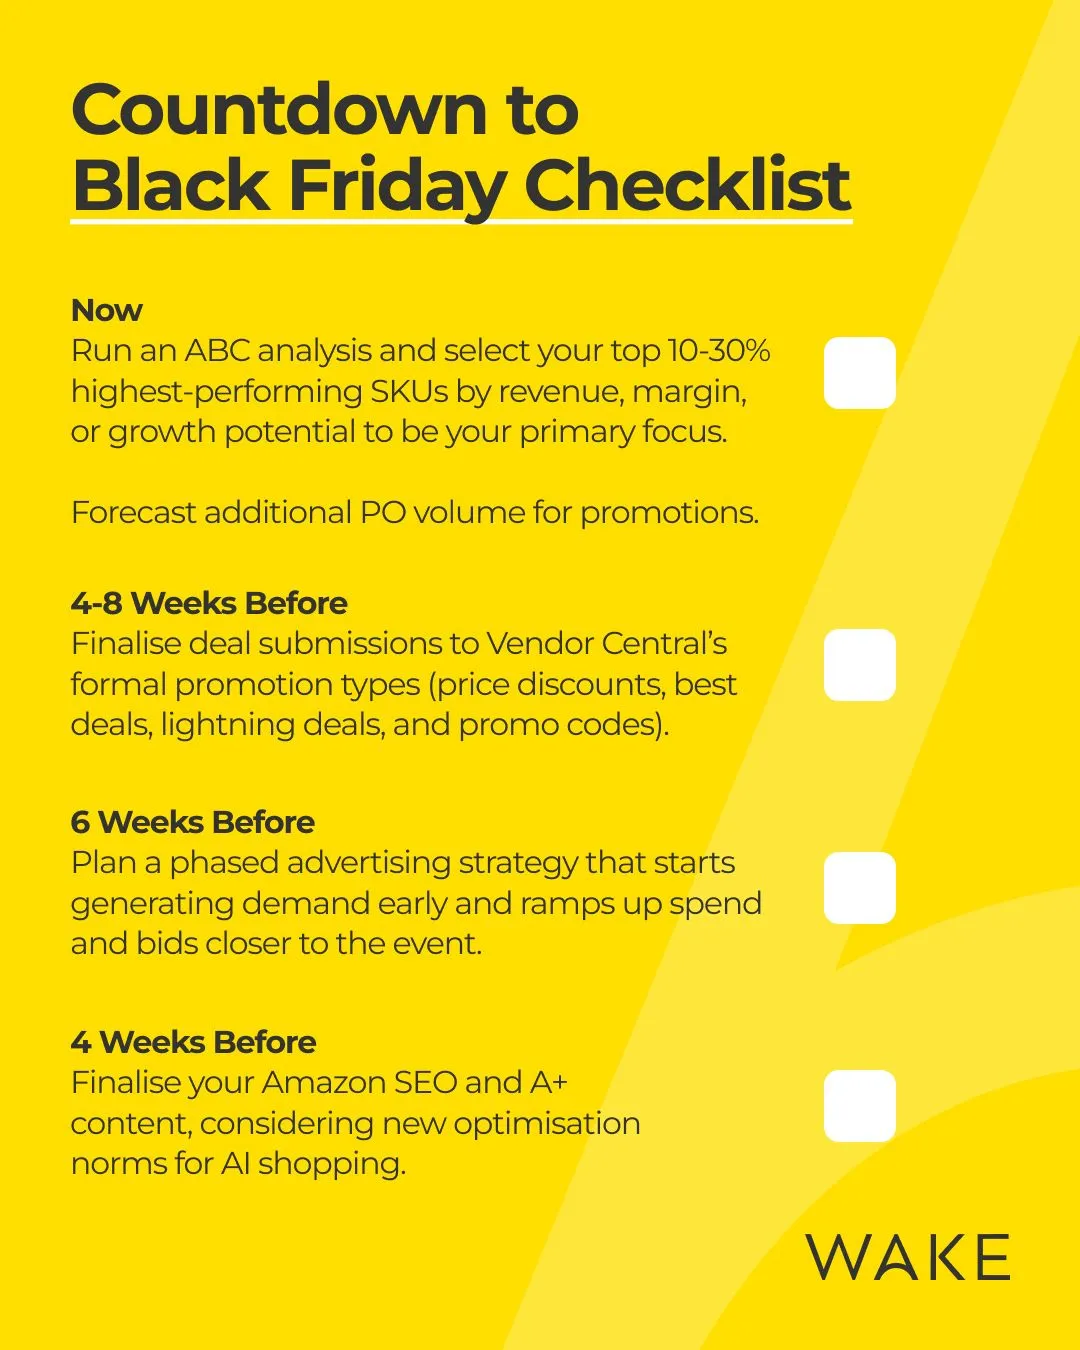
The most common forecasting failure in the corpus is a flat average. Take a product selling 100 units a week. Eight weeks at run rate is 800 units. Weight the four peak weeks at 3× their normal volume, add the four normal weeks, then apply 20% year-over-year growth, and you need 1,920. The same eight weeks, two methods, a 2.4× difference in the purchase order.
A forecast you cannot fund or fit is not a plan.
Trevor Ginn, founder, Vendlab
The five-step version operators describe: start from the real run rate of the last eight weeks, add year-over-year growth, weight the peak weeks separately instead of letting the spike disappear into an average, cover lead time including slower Q4 warehouse check-in, then cap the total against cash and restock limits. The last step is the one that keeps the first four honest.
Selling out is not a good problem in peak. Operators in this corpus describe cutting working ad campaigns because hero SKUs ran dry, losing marketplace rank that took months to rebuild, and pulling demand forward so hard that January and February had nothing to sell. Those accounts are self-reported and the specific percentages attached to them could not be verified, so treat the pattern as a warning rather than a benchmark.
There is one well-measured piece of good news about stock pressure. A field experiment on more than 840,000 Instacart customers found that telling shoppers when availability was low increased long-run order frequency by 5.7% and spending by 5.8%, while cutting refunds by 3.7% and product replacements by 2.9%. The version of this finding circulating in the corpus puts refunds at 2.6%, which is not what the study reports. Honest scarcity signals, based on your real stock feed rather than a countdown widget, pay off after the season as well as during it.
Support, payments and the fragile middle
Support volume moves faster than order volume because the same customers ask about shipping deadlines twice. Sierra, the conversational-AI vendor used by Minted, reports that Minted's AI agent absorbed a 387% month-over-month increase in conversation volume during BFCM 2025, covering customisation, order modifications and delivery deadlines. That is a single-customer figure published by the vendor, self-reported and not independently audited, and there is no resolution rate or CSAT attached to it. What it does establish is the shape of the curve, which is steeper than staffing plans usually assume.
Payments deserve a line of their own. Volume spikes trigger fraud review and payout holds in the one week where cash timing matters most. The operators in this corpus keep a second processor configured, backup ad accounts with spend history, and a promotional domain separate from the evergreen one. None of that is expensive in October and none of it is possible on Black Friday morning.
Dates the TikTok Shop US fulfilment thresholds and Amazon's Business Hour Delivery Rate requirement take effect, ahead of Black Friday on November 27.
First-party / research TikTok Shop Seller Center; Amazon Seller Central
TikTok Shop US Valid Tracking Rate and weekly On-Time Delivery Rate, with Seller-Fault Cancellation at 2.5% or below.
First-party / research TikTok Shop US Fulfillment Policy · policy
Units ordered by a flat eight-week forecast versus a peak-weighted one with 20% growth, same product, same period.
First-party / research recomputed worked example
Long-run order frequency and refunds after disclosing low availability, in a field experiment on 840,000+ customers.
First-party / research Knight & Mitrofanov, Management Science · paper
Handle with care
Amazon has not announced its 2026 event dates. The "12 days before Cyber Monday" pattern held in 2024 and 2025, and the shorthand some operators use for it is their own, not an Amazon programme name. Plan for a roughly two-week Amazon event ending November 30 and revisit when the dates are published, but do not print specific 2026 dates in a plan other people will act on.
What to do about it
Pull your marketplace compliance numbers today
TikTok Shop valid tracking, on-time delivery, late dispatch and seller-fault cancellation; Amazon account health and Business Hour Delivery Rate. These are measured on rolling windows that are already running, and a fix takes weeks of shipments to show up.
Write one lock date and circulate it
Mid-October, in writing, with a named owner. After it: no theme changes, no app installs, nothing touching checkout. Before it: the speed and checkout work you have been deferring since spring.
Stress-test the seams, not just the storefront
Order-to-cash, inventory sync, ERP and order routing across markets. The freeze protects systems; the failures happen between them.
Rebuild the Q4 order with peak weeks weighted separately
Real eight-week run rate, year-over-year growth, peak weeks weighted, lead time covered, total capped against cash. A flat average produced 800 units where the weighted method produced 1,920.
Turn your real stock feed into an honest availability signal
Low-availability disclosure has a measured effect on refunds and repeat orders. A countdown that is not connected to anything does not, and is now the kind of claim shoppers check.
Configure the redundancy in October
Second payment processor, backup ad account, separate promotional domain, and a support staffing plan built for a support curve steeper than the order curve.
Chapter 05
Email and SMS: the flows that carry peak
The owned channel is the only part of BFCM where a merchant sets the send list, the offer and the timing without bidding for any of it. The platform data says the money sits in a small, unglamorous corner of it: automated flows, multichannel reach and buyers who have bought before. The dashboard number everyone quotes — "email did 42% of revenue" — is not what most people think it is.
What holds up
- The channel is enormous at peak. Klaviyo delivered more than 22.7 billion messages over BFCM 2025, up 25% year over year, generating more than $3.8 billion in Klaviyo Attributed Value, up 27%, with nearly 20,000 customers hitting their best sales day ever (Klaviyo, 2 Dec 2025).
- Automation is the leverage. Omnisend's BFCM 2024 data has automated messages at about 3% of all November email sends but roughly 30% of all email-driven orders, with automations averaging a 45.43% open rate.
- Repeat buyers outgrew new ones. Klaviyo's BFCM 2025 release puts repeat-customer revenue up 13.5% year over year against 9% for new-buyer revenue.
- Multichannel recipients behave differently — but they are not a randomised group. Klaviyo: shoppers reached on more than one channel viewed 71% more products, added 34% more items to cart and placed 11% more orders than single-channel recipients.
- "42% of revenue" is an attributed-revenue share, not incremental lift. Klaviyo counts an order if it lands within 5 days of an opened or clicked email, or 24 hours of a text or WhatsApp message.
What the 42% actually measures
Klaviyo reports that email and text drove 42% of total revenue across its customer base during BFCM 2025, rising to 43% on peak days. That is Klaviyo Attributed Value as a share of total revenue, aggregated across a customer base of roughly 20,000 BFCM-active brands. It is not a comparison against a no-email counterfactual, and nothing in it isolates what the messages added.
The attribution window is the whole story. An order placed within five days of opening an email counts as email revenue, whether or not the email caused it. During a week when a shopper sees your sale in four places, that window catches almost everything. Treat the number as a health signal — is the owned channel carrying its share of a promotional week — and not as profit you would lose if you stopped sending.
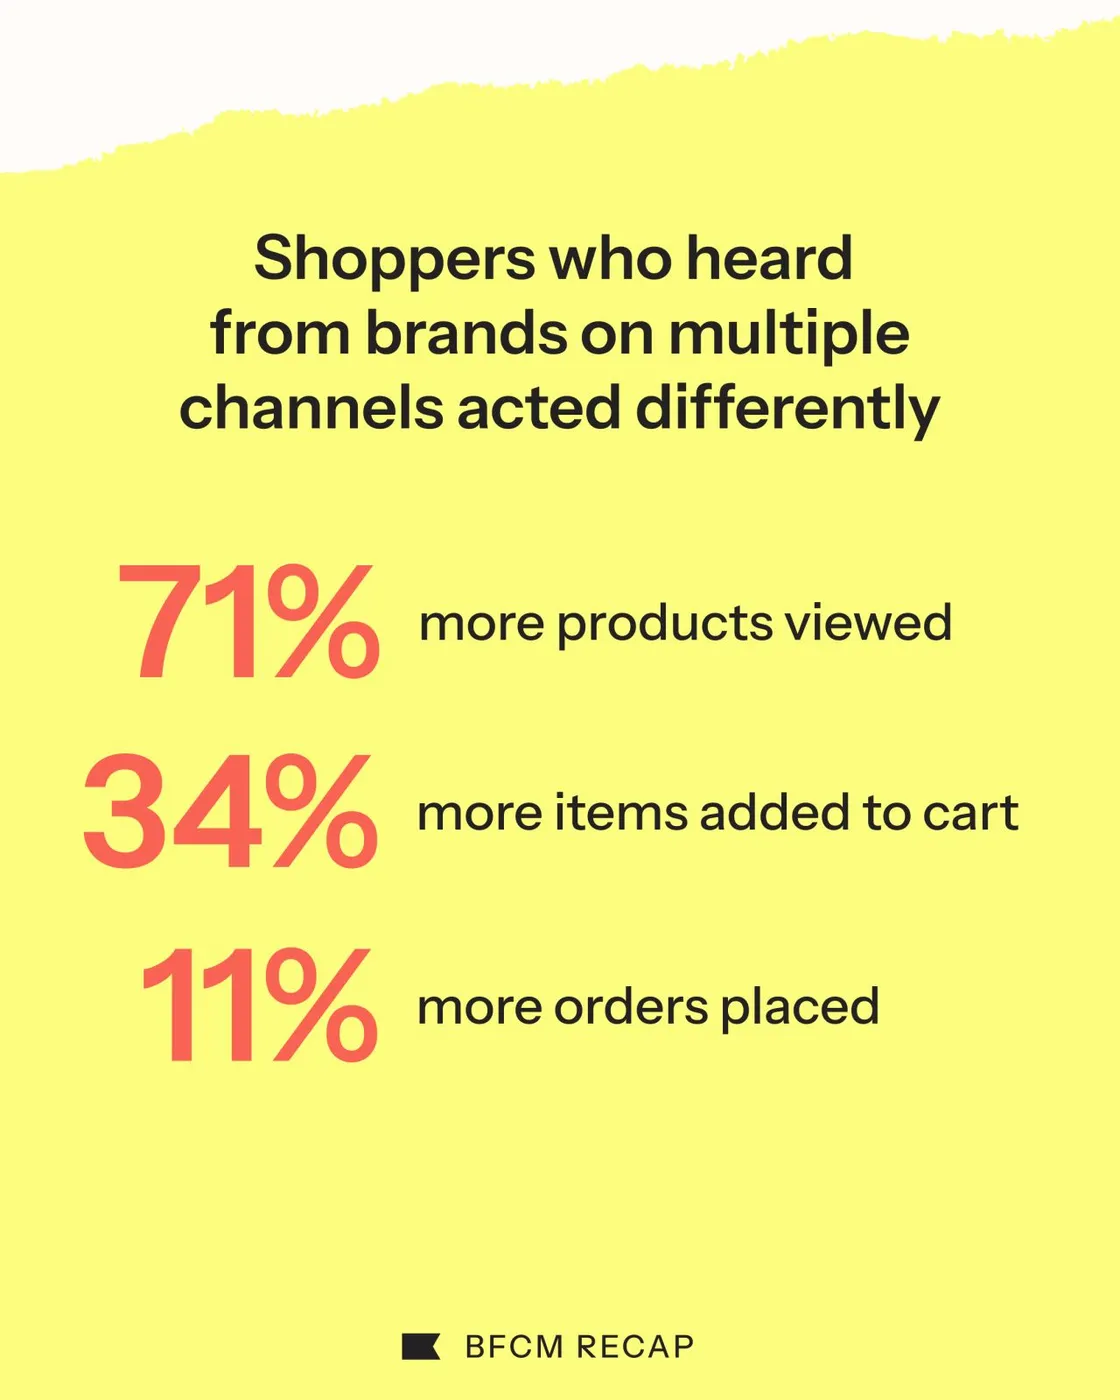
The same caution applies to the multichannel comparison in that figure. People who opted into both email and SMS are people who wanted more from the brand. Klaviyo's own framing compares multichannel recipients with single-channel recipients; it does not randomise who gets which. The direction is useful, the magnitude is not a lift you can bank.
Three per cent of the sends, thirty per cent of the orders
The cleanest third-party number in this corpus is Omnisend's, and it is about automation rather than volume. Across its merchant base during November 2024, automated messages made up about 3% of all email sends and produced about 30% of all email-driven orders. Automated emails averaged a 45.43% open rate and a 26.45% click-to-conversion rate.
Two flows do most of that work. In the same Omnisend data, the welcome automation had the highest click-to-conversion rate of any automation at 63.66%, with abandoned cart second at 44.57%. Read those as the share of people who clicked the message and then bought — not the share of recipients, and not the share of sends. Quoted without that denominator they look invented, and they will be dismissed by anyone who has seen a real cart-recovery report.
The operational implication is blunt. During the week when campaign volume triples, the flows that were written for a normal Tuesday are still running: a welcome email with an evergreen 10% code while the site is at 30% off, a cart sequence timed at one hour, four hours and twenty-four hours into a sale that ends Monday night. Rewriting those before November is cheap work with a measured share of orders behind it. Adding a fifth campaign is expensive work with a debate behind it.
Deliverability is a September decision
Every practitioner in this corpus agrees on the timing and almost none of them has a number for it. Rabah Rahil, CMO at Tie, relaying agency Sticky Digital, frames the window this way:
Black Friday is eleven weeks out. Getting a burned Gmail sender reputation back takes fourteen to sixteen.
Rabah Rahil, CMO, Tie — citing Sticky Digital, LinkedIn
We could not verify the 14-to-16-week figure against any published Google or third-party document; it is a self-reported agency estimate, not a documented benchmark, and Google publishes no fixed recovery timeframe. What is documented is the threshold. Gmail's published bulk-sender rule is a spam-complaint rate under 0.3%, with a softer internal target below 0.1%. Chronos Agency's own BFCM playbook sets stricter house guardrails — spam complaints under 0.01%, unsubscribes under 0.3%, bounces under 1% per send — which is an agency target ten to thirty times tighter than the platform rule, not an industry requirement. Use Google's number as the line you must not cross and pick your own margin above it.
Send more, or send smarter
This is the loudest live disagreement in the channel, and both sides are named. The send-more camp argues that inbox competition at peak makes extra sends incremental, and that restricting reach is a retreat: "Somehow email is the only channel where sending less to everyone gets called a strategy," Rahil writes. The send-smarter camp argues that a heavy BFCM calendar borrows revenue from January and trains the list to wait for discounts.
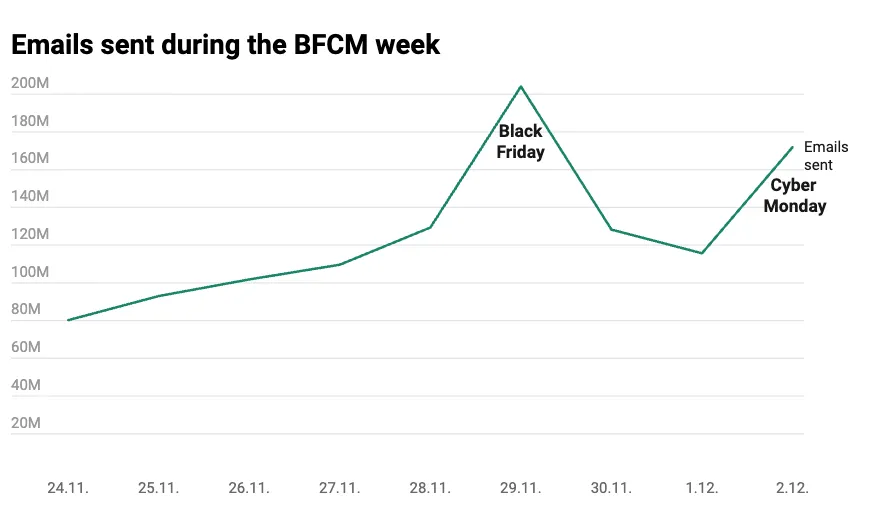
The volume context is real. Omnisend's platform data records about 204.1 million emails sent on Black Friday 2024 — the highest single day — and about 172 million on Cyber Monday. Nobody is winning that week on being louder.
Where the two sides agree is worth more than where they disagree: segment, suppress and time. Exclude anyone who has just bought from the next four "last chance" sends. Give the VIP list early access instead of another reminder. And know your send-time pattern — Omnisend found Black Friday email orders peaking between 7 a.m. and noon, with the 8 a.m. hour generating a third more orders than the next closest hour, while Cyber Monday email orders peaked between noon and 3 p.m. and SMS orders in the late-morning window. Omnisend's article states no timezone for any of those windows, so treat them as shape, not as a clock you can set.
Are you excluding people who just purchased from the next 4 "LAST CHANCE" emails? Please say yes.
Charlotte Rodrigues, CRM and email consultant — LinkedIn
The buyers who were already yours
The growth split in Klaviyo's BFCM 2025 data points away from acquisition: revenue from repeat customers grew 13.5% year over year, against 9% from new buyers. Loop Returns' Cyber Week 2025 numbers give a sense of how much of the weekend is a returning-shopper event at all: across its merchant base, 15.9 million orders and $1.94 billion in GMV from 12.8 million unique shoppers, which Loop puts at 16% of everyone who bought from a Shopify store that weekend.
Repeat buyers grew faster than new ones
Year-on-year revenue growth by buyer cohort across brands using Klaviyo, BFCM 2025.
Show data table
| Repeat buyers | 13.5% |
| New buyers | 9% |
The disagreement here is about timing, not direction. One camp re-engages BFCM buyers inside two weeks while the purchase is fresh; Nick Shackelford argues for 45 to 60 days before pushing a repeat purchase or a subscription, on the grounds that "your normal welcome flow assumes the customer chose you. Holiday buyers chose your discount." No dataset in this corpus settles it. What is settled is that the cohort needs its own segment from day one, because the flows built for a full-price first-time buyer are the wrong flows for someone who arrived at 30% off.
Where AI is actually earning its place
Modest and specific. Klaviyo reports that revenue from messages containing AI-powered product recommendations grew 71% year over year during BFCM 2025, while usage of the feature across its customers grew 45%. Read that precisely: it is year-over-year growth in revenue from AI-recommendation messages, driven partly by 45% more brands using them. It is not a measured lift against non-AI messages in the same period, and it should never be printed as one.
On the demand side, Klaviyo's 2025 Global AI Shopping Index (3,000 consumers in the US, UK and Australia, fielded 5–12 August 2025) found 56% planned to use AI shopping assistants during BFCM 2025. Planned to, in a pre-season survey. The practitioner reading is the interesting part: if assistants sit between your store and the shopper's discovery, the channels where you still hold the address — email, SMS, the post-purchase sequence — are the ones an agent does not intermediate.
Read the sample before the stat
Attentive's BFCM Marketer Pulse, widely quoted this season, surveyed 240 marketers between 2 and 18 June 2026 — all of them existing Attentive customers. That is a real, disclosed methodology and a self-selected, platform-using population at the same time. The same applies to every agency dashboard screenshot in circulation: single brands, vendor attribution, no baseline. Klaviyo and Omnisend platform aggregates are the only figures in this chapter with a population behind them.
Fix the flows before you add a campaign
Rewrite welcome, browse, cart, checkout and post-purchase for the sale — offer, real deadline, shorter delays — and schedule them to switch back afterwards. Automation was 3% of sends and about 30% of email orders in Omnisend's BFCM data; nothing else in the channel has that ratio.
Set your deliverability line in September, not November
Authenticate, clean bounces and traps, and warm volume in engaged layers. The published Gmail bulk-sender threshold is a 0.3% spam-complaint rate. Decide your own margin under it now, because there is no fast fix during Cyber Week.
Suppress before you send, every time
Recent purchasers out of "last chance". VIPs into early access rather than the general blast. This is the one point the send-more and send-fewer camps both make.
Tag the BFCM cohort on day one
Repeat-buyer revenue grew 13.5% against 9% for new buyers in Klaviyo's 2025 data. You cannot run that cohort separately in January if you did not mark it in November.
Report attributed revenue with its window attached
When you present "email did X% of BFCM", say the window — five days after an open or click, 24 hours after a text. It changes what the board does with the number.
Automated messages as a share of email sends versus a share of email-driven orders, Omnisend merchant base, November 2024 (BFCM period 24 Nov – 2 Dec).
First-party / research Omnisend · report
Messages delivered across Klaviyo's customer base during BFCM 2025, up 25% YoY, generating $3.8B+ in Klaviyo Attributed Value (up 27%).
First-party / research Klaviyo, 2 Dec 2025 · release
Year-over-year revenue growth, repeat customers versus new buyers, Klaviyo customer base, BFCM 2025.
First-party / research Klaviyo · release
Gmail's published spam-complaint threshold for bulk senders. One agency's internal BFCM guardrail is 0.01% — a house target, not a platform rule.
Named, secondhand Google Workspace Admin Help · guidelines
The honest summary of this channel is that its result was mostly decided before November. The list you walk into the month with, the sender reputation you protected in September, and the flows you rewrote in October are the parts you control. The campaign calendar is the part everyone argues about, and the part with the least evidence behind it.
BFCM revenue tells you how well you converted demand. The following 30–90 days tell you what kind of customers you actually acquired.
Diomar Guerrero, ecommerce Klaviyo strategist — LinkedIn
Chapter 06
Paid media and the honesty of the ruler
Every ROAS number you will look at in November is measured with a ruler that changes length inside the month. Attribution windows shift week to week, delayed conversions land after the test is over, and the platform's own automation reports its best number exactly where a large share of the sales would have happened anyway. The firms publishing that finding also sell the fix — which is a reason to read their methods, not to ignore them.
What holds up
- Meta's value capture moves inside November. Common Thread Collective's portfolio read: normally about 85% of attributed value lands inside 7-day click and 15% over the remaining 28-day window; in the two weeks before Black Friday the delayed 28-day share rises 47%, then falls 33% by Cyber Monday.
- Advantage+ over-reports. Across 640 Meta incrementality experiments run since the start of 2024, Haus measured Advantage+ campaigns over-reporting revenue by 12 percentage points versus manual campaigns, with manual delivering higher incremental ROAS in 58% of head-to-head brand tests (Haus, 28 Jul 2025).
- Lift arrives late, and most in Q4. Haus reports delayed lift exceeding immediate lift in 73% of its experiments, delayed lift 79% larger in Q4 than in evergreen periods, and video (YouTube and CTV) driving 286% more delayed lift than search — a vendor's own summary of its book of business, not a methodology-disclosing study.
- The macro was spend-led. Across Northbeam's customer base, Cyber Week 2025 ad spend rose 9.23% year over year, revenue 13.35%, MER improved 3.77%, and first-time-customer CAC rose 8.03%.
- Nobody has a sourced peak-CPM number. Every figure in circulation traces to an unsourced practitioner post — see the next chapter.
The window moves under you
Taylor Holiday, CEO of Common Thread Collective, published the clearest description of the problem from his agency's client portfolio. At baseline, roughly 85% of Meta-attributed purchase value is captured inside the 7-day click window, with about 15% trickling in across the remaining 28 days. In the two weeks before Black Friday, the delayed 28-day share rises 47% — shoppers are researching and waiting for the sale. By Cyber Monday it collapses 33%, because urgency has compressed the decision.
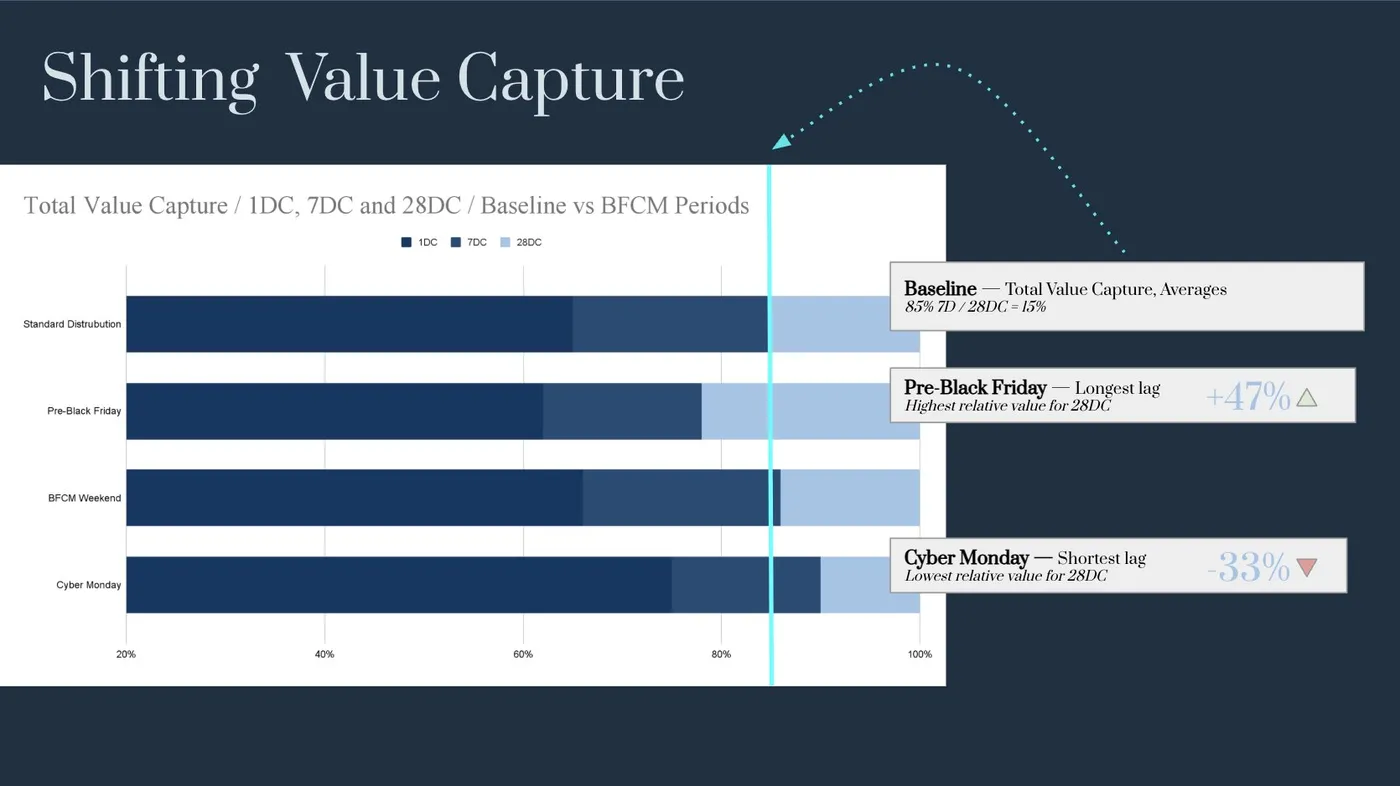
This is agency portfolio data with no brand count, no vertical mix and no stated year, so treat the exact percentages as one firm's internal read. The mechanism is not in dispute, and the consequence is arithmetic: a single 7-day ROAS target means three different things across November. Judged on day-one efficiency, the pre-Black-Friday ramp — the period doing the most delayed work — looks like the worst-performing fortnight of the year.
November is the month when the clock on ad performance breaks. Adjust your expectations by week, not just by channel or campaign, and you'll stay in sync with reality.
Taylor Holiday, CEO, Common Thread Collective — X, 2025
What the incrementality tests found, and who ran them
Haus, which sells geo-lift incrementality testing, reports from five years of BFCM experiments that delayed lift exceeded immediate lift in 73% of them, that delayed lift is 79% larger in Q4 than in evergreen periods, and that video channels drove 286% more delayed lift than search. Its chief strategy officer, Olivia Kory, also reports that pre-BFCM experiments on average drive more than 2x their measured value after the treatment window ends, with Pinterest, TikTok and Meta clustering at 1.2–1.23x post-treatment and Google Search, PMax and AppLovin at 1.06–1.12x.
Those figures come from promotional posts rather than a published report with a disclosed sample, and Haus's own separately-published Cyber Week report — built on 100+ tests across BFCM 2025 — gives different numbers for adjacent claims, which suggests two distinct analyses rather than one restated dataset. Three of Haus's better-documented findings do each sit on a named sample: YouTube driving 3.4x more incremental lift than Google Ads reports (190 incrementality tests, 74 brands), TikTok delivering 68% more lift in the post-campaign window and 1.9x more value once Amazon and retail impact is counted (hundreds of experiments over 2.5 years), and CTV efficiency improving 344% during Cyber Week once delayed conversions are counted (100+ tests, BFCM 2025). A fourth claim circulating alongside them — that brands ramping spend early in Q4 saw 75% efficiency improvements — is not supported by anything Haus has published; the only "75%" in its material is a fleet-wide measurement-timing figure with nothing to do with ramp timing. Drop it.
The Advantage+ finding is the best-documented number in this chapter
Haus's Meta report is the exception: a fetchable, methodology-disclosing analysis of 640 Meta incrementality experiments run by its customers since the start of 2024, average test duration 18.6 days with an 8.8-day post-treatment observation window. It found Advantage+ campaigns over-reporting revenue by 12 percentage points relative to manual campaigns — for every $100 of platform-reported revenue, manual delivered roughly $12 more real revenue on average. Manual campaigns also showed higher post-window lift (+32% versus +17%), and 58% of brands saw higher incremental ROAS on manual in head-to-head tests. The stated mechanism is cannibalisation: Advantage+ takes more credit for demand that already existed.
Say the conflict out loud when you quote it. "Advantage+ over-reports and manual is better" is precisely the finding that sells more incrementality engagements. That does not make it wrong — it is the only claim here backed by a named sample, a stated test design and a disclosed observation window — but the number belongs in a sentence with its author's business model attached.
Handle with care
The single most-shared incrementality anecdote of the season is one unnamed brand: $5M of Meta spend, 4.5x platform-reported ROAS, 2.7x measured by geo-lift — implying roughly $9M of credited sales that would have happened anyway. It comes from incrementality consultant Shishir Acharya, with no vendor, holdout design or confidence level disclosed, and no way to check the 2.7x against a named test. Use it as an illustration of how far attributed and incremental can diverge. Do not use it as a benchmark, and do not assume your own gap is half.
The measurement vendors are also the channel analysts
Triple Whale published the largest cross-platform comparison in this corpus: 755 AppLovin-spending shops over 12 months, read three ways. Click-attributed ROAS came out at 2.90 for AppLovin against 2.08 for an aggregated leading-social benchmark, with 61% of qualifying shops higher. A proprietary MMM trained on about 6,300 shops found 66% of AppLovin advertisers showing a higher expected incremental return per extra dollar than their own benchmark elsewhere. And seven independent geo holdout tests produced five statistically significant results, all positive, averaging +8.3% revenue lift (range 3.5% to 13.5%) — on a channel that was only 7.7% of the cohort's combined ad spend.
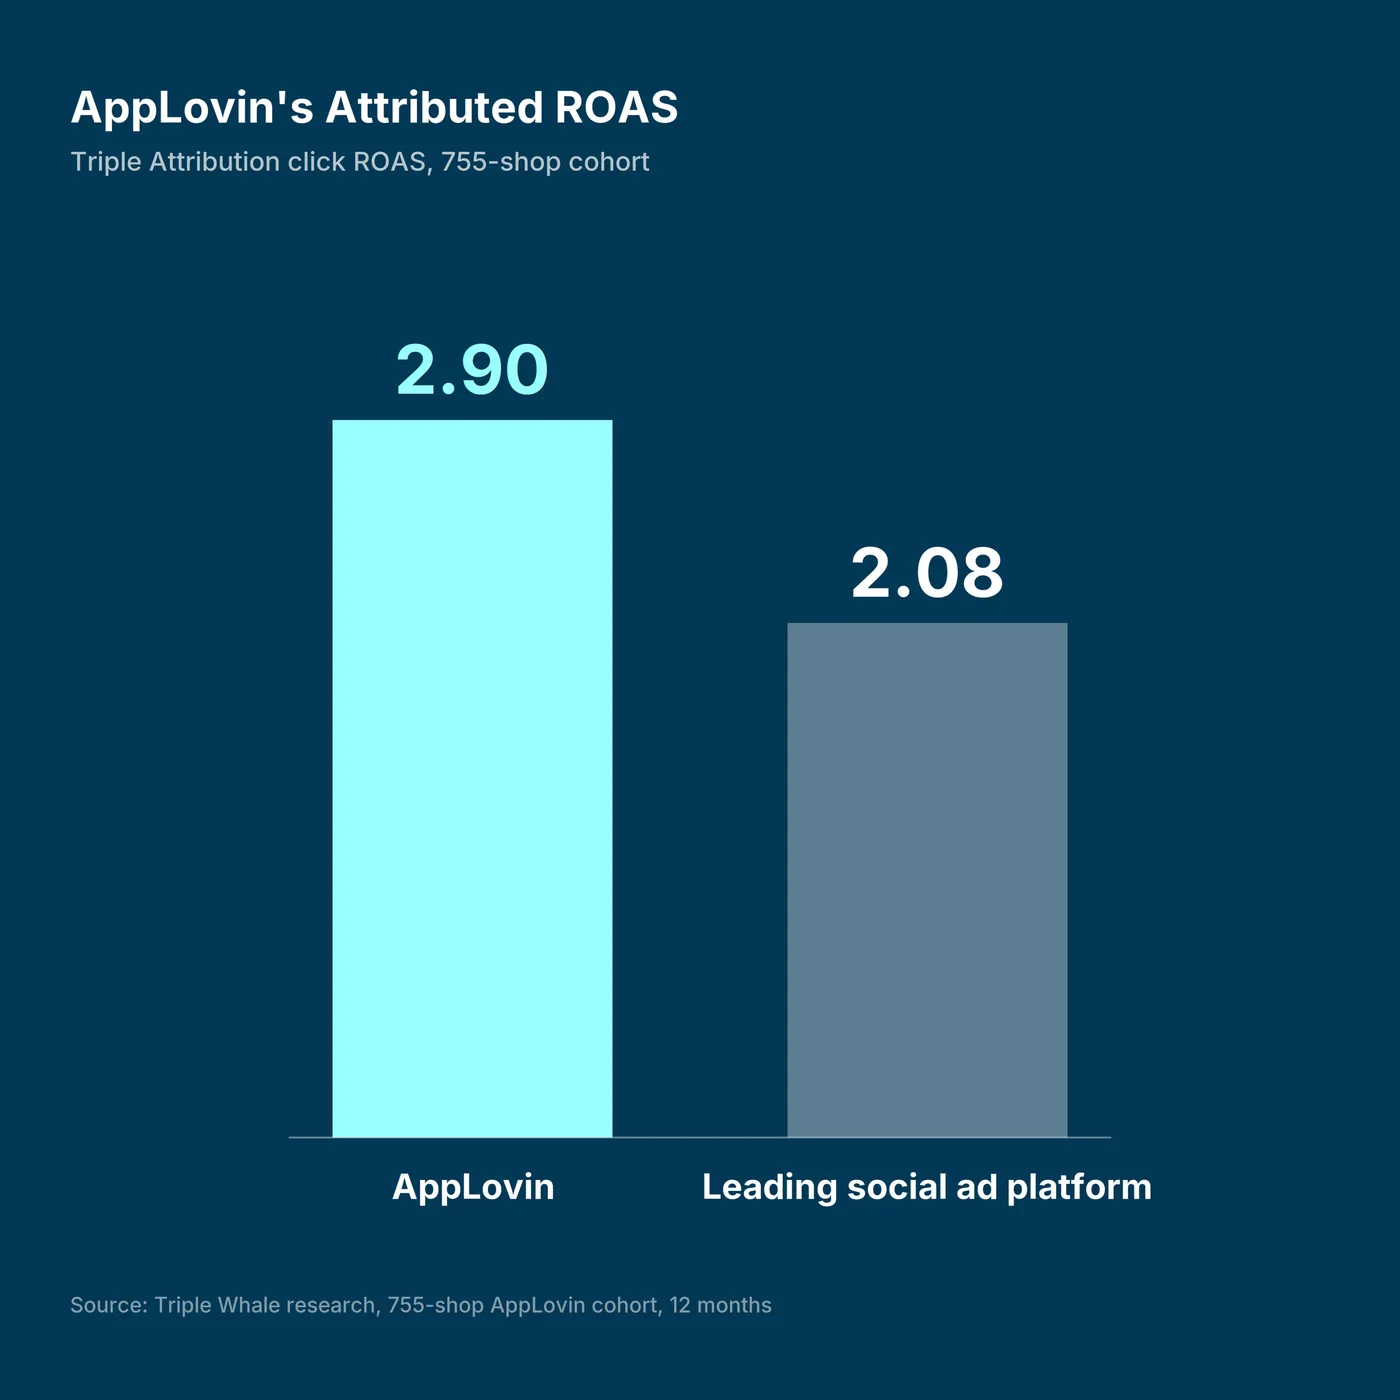
Read the conflict in the other direction this time. Triple Whale is the measurement vendor and it has a product and referral partnership with AppLovin. This is a vendor validating its own partner's platform — the mirror image of the usual "platforms over-report" incentive, and arguably a sharper one. Two of the seven geo tests did not reach significance and are excluded from the +8.3% average by the report's own methodology. "Other platforms" means an aggregated social benchmark, not literally every other channel.
What a geo test finds after the platform has already reported
Measured incremental value as a multiple of what the platform's own reporting showed. Each row is a different channel and a different comparison, so read them one at a time.
Show data table
| YouTube · incremental lift vs what Google Ads reported | 3.4× |
| TikTok · value once Amazon and retail sales are counted | 1.9× |
| What the platform reported (baseline) | 1× |
Two spend-share panels that must never be quoted side by side
Triple Whale's BFCM read has Meta's share of ad spend moving from 67.81% to 67.6% and Google's from 23.14% to 22.65%, while TikTok's share grew 24% year on year and AppLovin's 36% off much smaller bases. Northbeam's Media Buyer Index for the week of 29 June – 5 July 2026 has Meta at 49.13% of budget share. Both are real; they measure different cohorts, different windows and possibly different definitions of "share". Stacking them into a single trend line is the most common way this section of a deck goes wrong.
That same Northbeam table carries a useful warning about relayed data. The post circulating it narrated "Meta is up across the board: conversion rate +18%, ROAS +14%" while the attached table showed Meta CVR at −8.18%, ROAS at −2.39% and budget share down 2.98 points. The post and its own screenshot disagreed, and the screenshot was right.
When the money actually moves
The only spend-shape evidence in the corpus is an analyst's heatmap built from $585.8 million of Meta spend across BFCM 2024: Thanksgiving the lowest-intensity day, intensity rising sharply from the Sunday and the heaviest cells around midday Cyber Monday, on a colour scale running roughly $2M to $10M per hour. No methodology, account composition or timezone is disclosed, and the peak values are read off a colour band rather than a label. It argues for pacing in hours rather than days.
Two 2026-specific pressures sit on top of that. AdImpact projects $10.8 billion of US midterm political ad spending, later revised up to $11.6 billion, and there are only 24 calendar days between Election Day (3 November 2026) and Black Friday (27 November 2026) — a squeeze concentrated in local news, live sports and prime time rather than in social feeds. Tatari's advertiser survey found nearly six in ten surveyed retail and DTC advertisers plan to increase BFCM TV spend in 2026; the respondent count is not disclosed anywhere, so quote the direction and not a sample.
It is so incredibly easy to not drive incremental results the week of BFCM and be extremely happy with your outcome.
Cody Plofker, Jones Road Beauty — quoted in a Q4 playbook post
The counter-argument to testing at peak is practical and it is held by serious operators: a holdout in the most valuable week of the year means going dark in the most valuable week of the year. Haus's own pre-Q4 guidance concedes it — test upper funnel now, run 2-3 cell A/B/C designs rather than holdouts during the sale, and add a post-treatment window that runs through the sale so a test is not cut at its midpoint and read as a false negative.
Set a different efficiency target for each week of November
Pre-Black-Friday spend is doing delayed work — the 28-day share rises 47% in that fortnight in Common Thread's read. Judging it on a Cyber Monday target will make you cut the ramp that pays for the peak.
Run one geo test before peak, not during it
Pick the channel carrying the most budget on the weakest evidence. Two-thirds of the value of a test is knowing which of your platform numbers to discount, and you only need that answer once.
Discount Advantage+ deliberately in your planning model
Haus's 640-experiment finding is a 12-percentage-point over-report versus manual. You do not have to believe the exact number to stop planning inventory and cash off an undiscounted platform ROAS.
Pace in hours through the weekend
Build the hourly sheet, name who can move budget, and log every change. The only spend-shape data available shows the peak landing midday Cyber Monday, not spread across the day.
Ask who benefits from every measurement stat you repeat
Incrementality vendors publish findings that sell incrementality. Attribution vendors publish findings that flatter their own partners. Both can be true and both need the disclosure in the same sentence.
Advantage+ revenue over-reporting versus manual campaigns, across 640 Meta incrementality experiments run since the start of 2024; 18.6-day average test, 8.8-day post-treatment window.
First-party / research Haus, 28 Jul 2025 · report
Average measured revenue lift across five statistically significant geo holdout tests of seven, AppLovin, in a 755-shop cohort over 12 months. Two tests did not reach significance and are excluded.
Named, secondhand Triple Whale · report
Cyber Week 2025 year-over-year ad spend and revenue growth across Northbeam's DTC customer base; MER +3.77%, first-time-customer CAC +8.03%.
Named, secondhand Northbeam, 22 Dec 2025 · post
Between US Election Day (3 Nov 2026) and Black Friday (27 Nov 2026), against AdImpact's projected $10.8B of midterm political ad spend — pressure on local news, live sports and prime time.
First-party / research AdImpact · projections
The thing worth carrying out of this chapter is not a number. It is that the celebratory ROAS screenshot is the least reliable artefact of the season, and it is produced in the greatest volume exactly when it is least reliable. Every operator who tested found a gap. None of them found the same gap.
Chapter 07
Creative, and what AI creative really does
The most-shared creative statistic of 2026 — AI ads win clicks and lose sales — is two unrelated studies glued into one chart. The clicks half is real research over 500 million impressions, and it concluded the opposite of what the chart implies. The sales half comes from a separate agency benchmark with no published methodology. Unpicking that graphic is the most useful thing this chapter can do, because the same splice is how almost every creative claim in this corpus is built.
What holds up
- The CTR figures are real and correctly attributed: 0.76% for AI-generated ads versus 0.65% for human ads, from a Taboola-sponsored study with Columbia, Harvard, CMU and TU Munich across 500M+ impressions and 3M+ clicks (28 Jan 2026).
- That study's own conclusion is comparability. Taboola's release states AI-generated visuals "increased or maintained click-through rates without reducing downstream conversion performance."
- The −8% / −14% conversion drops come from a different dataset entirely: an AdBeacon / Digital Applied benchmark of about 50,000 ad variations across Meta, Google and TikTok, published 22 July 2026, with no stated overlap with the Taboola sample and no published methodology.
- No peak-CPM inflation number in this corpus has a source. Not one of the four figures in circulation names a dataset, a cohort or a vertical.
- The one large, dated creative benchmark with a disclosed sample is Billo's: 80,069 sales-objective Meta video ads across 14 verticals — and its window is July to December 2025, not Q4, despite being sold as a Q4 calculator.
The splice, shown
A graphic titled "AI Ads Win Clicks. Human Ads Win Sales." circulated through August and September 2026. It carries four numbers: 0.65% CTR for human ads, 0.76% for AI ads, then a conversion-rate drop for AI ads of 8% on purchases over $100 and 14% over $500, with no significant difference under $100. Its fine print cites both sources correctly. Its layout, headline and every retelling present them as one finding.
AI-generated ads won the click — by 0.11 of a percentage point
Click-through rate across hundreds of thousands of live ads, 500M+ impressions and 3M+ clicks. The study's own conclusion: once statistical controls are applied the two perform comparably, and it found no reduction in downstream conversion.
Show data table
| AI-generated ads | 0.76% |
| Human-made ads | 0.65% |
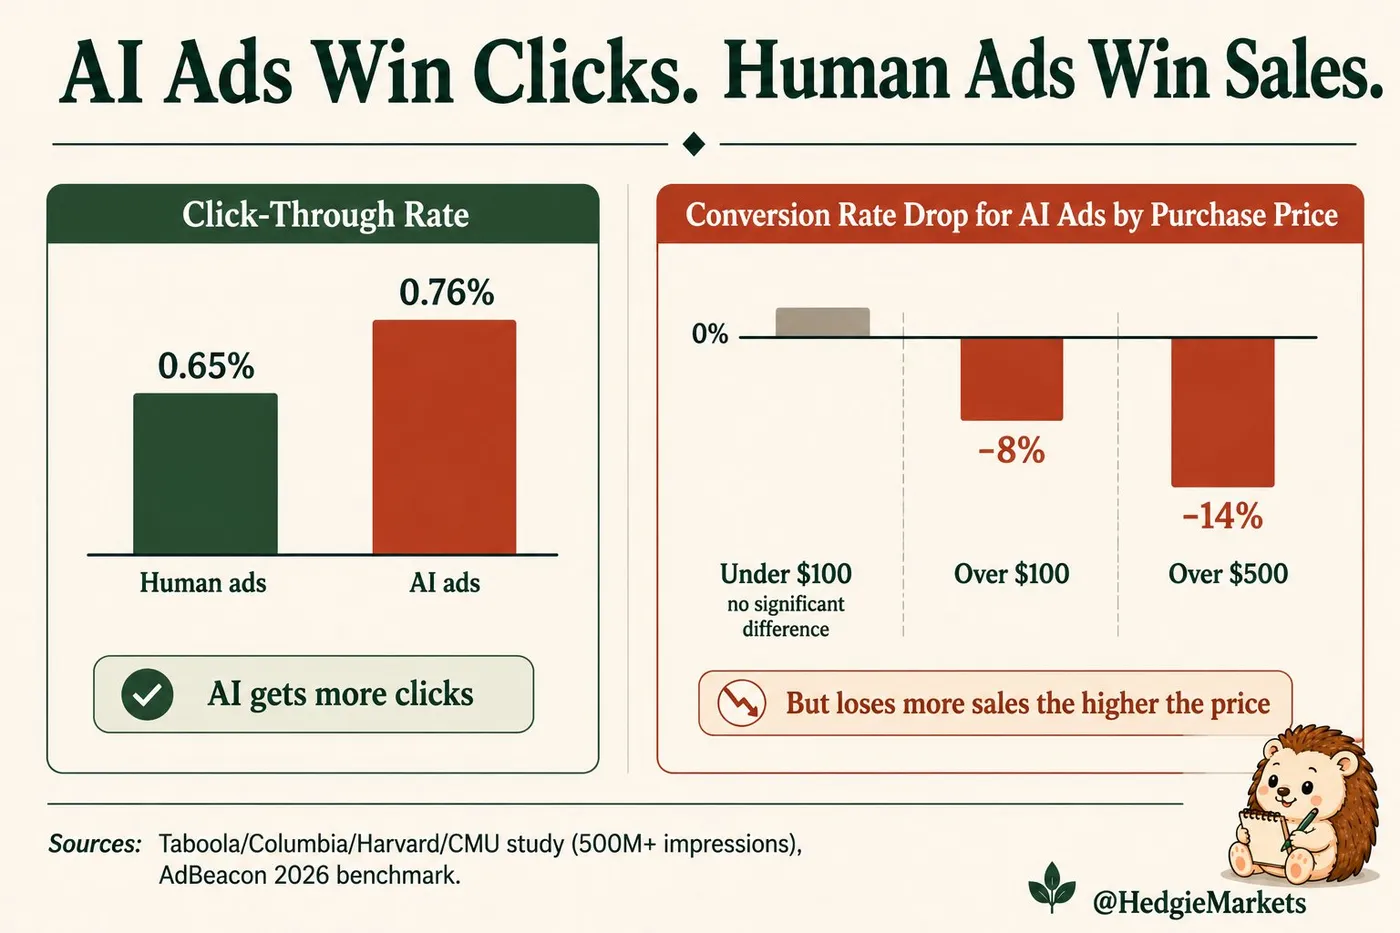
They are not one finding. The CTR pair comes from a joint academic-industry study run on hundreds of thousands of live ads on Taboola's Realize platform — 500 million-plus impressions, three million-plus clicks — with researchers from Columbia Business School, Harvard, Carnegie Mellon and TU Munich. Once statistical controls were applied, that study concluded that AI-generated and human-made ads perform comparably, and it explicitly found no reduction in downstream conversion performance for AI creative.
The conversion pair comes from an unrelated agency benchmark: roughly 50,000 ad variations across Meta, Google and TikTok, different advertisers, different platforms, published six months later, with no methodology anyone can inspect. There is no stated sample overlap with the Taboola study, no disclosed control, no confidence interval.
Put together, the chart produces a conclusion that neither source supports and that directly contradicts the stated finding of the larger one. The account that posted it went further in the surrounding text, claiming AI ads had "stopped converting outright" — a claim the graphic's own numbers refuse, since they show no significant difference under $100.
How to read any creative claim after this
Ask three questions of every chart with two halves. Same sample? Taboola's ads and AdBeacon's ads share nothing but a topic. Same metric family? A click-through rate and a conversion rate move for different reasons and can diverge without contradicting each other. Same conclusion as the source? Here the fine print cited a study whose published conclusion was the opposite of the headline. A correct citation at the bottom of a chart is not the same thing as a correct chart.
What can honestly be said about AI creative performance
Very little, and that is the finding. The production economics have moved by an order of magnitude — practitioners in this corpus cite figures from under $1.20 per finished ad to $49 per video against $300–500 for a creator video — but none of those numbers is sourced, and one of the most-repeated versions ("347 Black Friday ads generated in 48 hours... $49 vs $500/video") appears word for word from two unrelated accounts three months apart. That is a copied template, not a measured result, and it should never be cited as evidence of anything.
On the performance side, the Taboola study is the only large controlled comparison anyone in this corpus has, and its answer is "comparable". TikTok platform claims circulating this season — a 30% higher BFCM GMV with GMV Max, a 56% ROAS lift on product-focused beauty videos with Smart+ Catalog — could not be located in any TikTok-published or trade-press source, including TikTok's own BFCM 2025 newsroom coverage, which cites entirely different figures. Treat them as unverified.
Volume, distinction, and a case study that does not check out
The loudest consensus in the paid-media corpus is that a winning ad plus a BLACK FRIDAY banner is no longer a strategy, and that under Meta's creative-similarity grouping a minor reskin may not even register as a new ad. What practitioners disagree on is the number that follows. Volume heuristics range from 10–25 ads per ad set to 20–50 fresh concepts to 300-plus in-house BFCM assets; the counter-camp argues win rate beats ad count.
Neither side has a dataset. Two specific numbers are worth flagging because they get quoted as settled. The recommendation of "10–25 ads per ad set instead of 5", attributed to creative strategist Dara Denney, conflicts with a separate published summary of her guidance describing 5–6 ads per ad set; her original video could not be located, so the figure should not be cited as her settled position. And the widely-shared HexClad result — assets cut from 75 to 25, add-to-cart up 56%, conversion up 23% — could not be found in Motion's accessible case-study content. The confirmed, published Motion/HexClad figure is a different metric entirely: top-of-funnel spend increased 60% using Motion's creative testing workflow. The argument behind the story still stands on its own:
More assets does NOT equal better performance. Your customers need one easy story they can follow.
Kyra Richards, Head of Customer Success, Motion — on HexClad
The sharpest version of the trade-off comes from an agency owner watching his own market reprice:
Any agency can now offer 2x the ads for the same retainer, and that is the offer they took. But what they traded off was a higher winning rate.
Marco Battaglia, performance creative agency founder — X
Nobody knows what November CPMs actually do
This deserves to be said plainly, because it is repeated in almost every BFCM deck. Four CPM-inflation estimates circulate in this corpus: that running the same budget in Halloween week costs 15–34% less than waiting for Black Friday; that CPMs surge 30–50% in November; that they spike 50–100% during peak week; that December CPMs are the highest of the year. All four trace to social posts — Ashley Pomeranz, 99minds, Manoj Bash and one general claim with no number attached. Not one cites a data source, a cohort, a vertical or a time window. The three quantified versions are mutually inconsistent with each other.
We could not find and read a single dated, methodology-disclosing October-to-December CPM series covering two years to replace them. So this report prints no peak-CPM inflation figure. If you need one for a plan, measure your own account's October and November CPMs from last year and use that, labelled as your own account, rather than borrowing a number nobody can trace.
The benchmark that is sold as Q4 and is not
The largest disclosed creative benchmark in the corpus is Billo's Q4 Performance Calculator, built on 80,069 sales-objective Meta video ads across 14 industry verticals. The sample size and vertical count are exactly as advertised. The window is not: Billo's own blog states the ads ran between July and December 2025 — the second half of the year, not the October-to-December quarter the tool is named for. If you score your hook rate or CTR against it, you are scoring against a half-year that includes a normal-demand summer. That is not disqualifying; it is a different baseline than the one the product name implies.
The risk that is not measured anywhere
AI production has made one category of ad cheap that used to be impossible: a synthetic person who does not exist, making a claim, with nothing in frame disclosing either fact. The corpus contains AI-generated "creator" personas with hooks like "Every husband needs to understand this" selling a beetroot supplement with a Black Friday link; a supplement hook built on "Woman claims this happens when she takes..."; a cartoon explaining high blood pressure. There is also a practitioner describing how to clone a real creator's video and modify her face while keeping everything else, and another explicitly marketing AI UGC as content "Meta thinks is real".

The practitioners producing these ads describe the enforcement reality accurately: "almost every rejection is about the claim, not the video," as creative strategist Yuanda W puts it — "if you put a doctor on stage making a direct medical promise then ofc you're getting flagged." The fix being traded is to drop the authority framing rather than the claim. For an operator with a brand to protect and a regulator to answer to, that is the wrong end of the problem to optimise.
if your entire bfcm creative strategy is: take the winning ad, add BLACK FRIDAY, put 30% OFF underneath it — you don't have a bfcm creative strategy lol.
Lina Fahizul, direct response consultant — X
Verify both halves of any two-part chart before it enters a deck
Open the two fine-print citations and read each source's own conclusion. The most viral creative stat of 2026 fails that test in under ten minutes.
Test AI creative against your own account, not against a benchmark
The only controlled comparison available concluded AI and human ads perform comparably. That is a reason to run your own split, not a reason to switch a production pipeline on a chart.
Measure win rate, not asset count
Both sides of the volume debate are unsourced. Your own ratio of ads launched to ads that clear target CPA is a number you already have and nobody can splice.
Use your own CPM history for November planning
No sourced peak-CPM series exists. Last year's account data, labelled as yours, is more honest than any figure in circulation.
Write a disclosure rule for synthetic creative before you need one
Decide now whether an AI-generated person may appear in your ads, whether they may make a product claim, and what appears on screen when they do. This is currently governed by ad-review outcomes, not by policy.
Click-through rate, AI-generated versus human-made ads, across 500M+ impressions and 3M+ clicks. The study's own conclusion: comparable performance, with no reduction in downstream conversion.
First-party / research Taboola with Columbia, Harvard, CMU, TU Munich · release
Conversion-rate drop for AI ads above $100 and above $500 — from a separate, methodology-free benchmark of ~50,000 ad variations across Meta, Google and TikTok. Not part of the study above.
Weak source AdBeacon / Digital Applied, 22 Jul 2026 · post
Sales-objective Meta video ads across 14 verticals behind Billo's "Q4" benchmark calculator — running July to December 2025, a half-year window, not the quarter.
Named, secondhand Billo · benchmarks
Peak-CPM inflation figures in this corpus with a named dataset, cohort or period behind them. Four estimates circulate; all four are unsourced social posts, and the quantified ones disagree with each other.
Weak source unsourced practitioner posts
The practical position for BFCM 2026 is unsatisfying and defensible. AI has made the marginal ad nearly free, which means volume is no longer scarce and cannot be an advantage. The evidence that AI ads sell worse does not exist in any form that survives reading. The evidence that they sell better does not exist either. What remains is the part nobody automated: knowing which angle is worth making at all.
Chapter 08
AI shoppers: the new discovery layer
AI is the fastest-growing source of retail traffic and one of the smallest. Both halves of that sentence are measured, and almost every argument about this channel comes from quoting one half. The harder problem for an operator is that the growth is real, the quality signal is real, the mechanism changed overnight in July, and only about a quarter of merchants can connect any of it to a sale.
What holds up
- One Adobe series, three windows: AI-referred traffic to US retail sites was up 805% on Black Friday 2025, 670% on Cyber Monday, and 693.4% across the full Nov 1 – Dec 31 season. Adobe's own caveat, in its own words: "the base of users remains modest."
- Adobe publishes no share of total retail traffic to sit beside those growth rates. Anyone who gives you one has made it up or borrowed it from a different population.
- Sensor Tower's published Rufus finding is a session share: 40% of Amazon app sessions on Black Friday 2025, up from 30% on 1 November, easing to 38% by month-end. The widely-repeated "66% of purchases" and "100,000-session panel" figures do not appear in its post.
- The two headline ChatGPT-versus-organic conversion studies disagree because their baselines disagree — one strips branded search out, the other does not.
- On 10 July 2026, ChatGPT Shopping picks sourced from integrated merchant feeds went from 8.26% to 61.54% in a single day, across 1,757,723 tracked prompt runs (Profound).
- Only 23% of merchants can connect AI-driven traffic to the purchases it produces; another 21% can see the traffic and not the sale.
The growth rates, as one series
Adobe Analytics has published the same metric — year-over-year growth in visits to US retail sites referred by generative-AI tools — at several cuts of the 2025 season, and the figures get quoted as though they were different findings. They are one series. Black Friday alone (28 November): +805%. Cyber Monday alone: +670%. The full holiday season, Nov 1 to Dec 31, in Adobe's final January 2026 recap: +693.4%. The UK equivalent for the same season was +329%, with Boxing Day alone up 685%, and Adobe noted UK volumes "remained small relative to other channels."
AI-referred traffic: one series cut three ways, not three competing claims
Year-on-year growth in generative-AI-referred visits to US retail sites. Same measurer, same metric, three windows. The year-earlier base was near zero, which is most of why the percentages are this large.
Show data table
| Black Friday 2025 (Nov 28) | 805% |
| Cyber Monday 2025 (Dec 1) | 670% |
| Full season (Nov 1 – Dec 31 2025) | 693.4% |
Two things to keep attached whenever you print any of them. First, the window: a Black Friday number and a two-month season number are not interchangeable, and the +4,700% figure still circulating is an older Adobe monthly reading being reused without its period. Second, the base. These are growth rates measured against a period when assistants barely registered, and Adobe has never published the share of total retail traffic AI represents. The closest real number measures the inverse population: mobile-analytics firm Apptopia found ChatGPT referral sessions to e-commerce apps were 0.82% of all ChatGPT sessions on Black Friday 2025, up from 0.64% a year earlier — the share of the assistant's own sessions that pushed a shopper onward, not the share of retail traffic that came from the assistant.
What those visitors are worth, and against what
Every large dataset says AI-referred visitors convert better than the visitors they are compared with. Adobe's readings, each from a different release: +38% on Black Friday 2025, +31% across the 2025 season, +42% in March 2026, +40% across the full Prime Day 2026 event, and +60% in Adobe's July 2026 data — its eleventh straight month of AI traffic out-converting other channels. Revenue per visit ran 37% higher in March 2026 and 53% higher in the July 2026 cut. In March 2026 those visitors also spent 48% longer on site and viewed 13% more pages per visit than non-AI traffic.
Shopify's Q1 2026 commerce data reports the same direction against a narrower baseline: AI-chatbot-referred sessions grew more than 8x year over year and AI-referred orders nearly 13x, with those sessions converting at nearly 50% higher rates than organic search and carrying 14% higher average order values.
None of this is a controlled test. Adobe compares AI traffic with every other channel a retail site tracks; Shopify compares AI with organic search. In both, the AI group is composed of people who chose to shop through an assistant. That is a selection effect. It tells you the traffic is worth catching. It does not tell you that optimising for assistants creates incremental revenue.
The absolute numbers, which are small
Four independent readings, all pointing the same way. Etsy's CEO has told investors that agentic traffic remained under 1% of Etsy's total site traffic in both Q4 2025 and Q2 2026 — even after growing roughly 15x year over year in Q4 2025. John Lewis's managing director Peter Ruis told Reuters that AI-agent-driven product searches reached 2.5% of the retailer's product searches in 2026, up from 0.3% a year earlier. Brainlabs' study of 54 of its own clients (January 2025 to April 2026) found AI-platform referral sessions up 163% to roughly 200,000 a month on average, while the same clients' organic sessions fell 10.5% — from 140.1 million to 125.4 million.
The sharpest version comes from 180 Marketing's 94-brand GA4 study. Across the full year 2025, ChatGPT-referred revenue was $474,000 against $32.1 million from non-branded organic search: 1.48% of it, rising to 2.2% in the second half. Organic sessions outnumbered ChatGPT sessions 70 to 1 for the year, narrowing to 47 to 1 by Q4 as ChatGPT traffic grew 1,079% against organic's 17%.
It is the best traffic in retail and there is almost none of it.
Adrian Luna, SVP Growth, Webscale — LinkedIn
Rufus: what Sensor Tower actually published
The most-cited AI-commerce statistic of the season is a stack of numbers, only some of which exist. What Sensor Tower published in its December 2025 analysis is a session share: Rufus accounted for 40% of Amazon mobile-app sessions on Black Friday 2025, up from 30% on 1 November, settling at 38% by month-end.
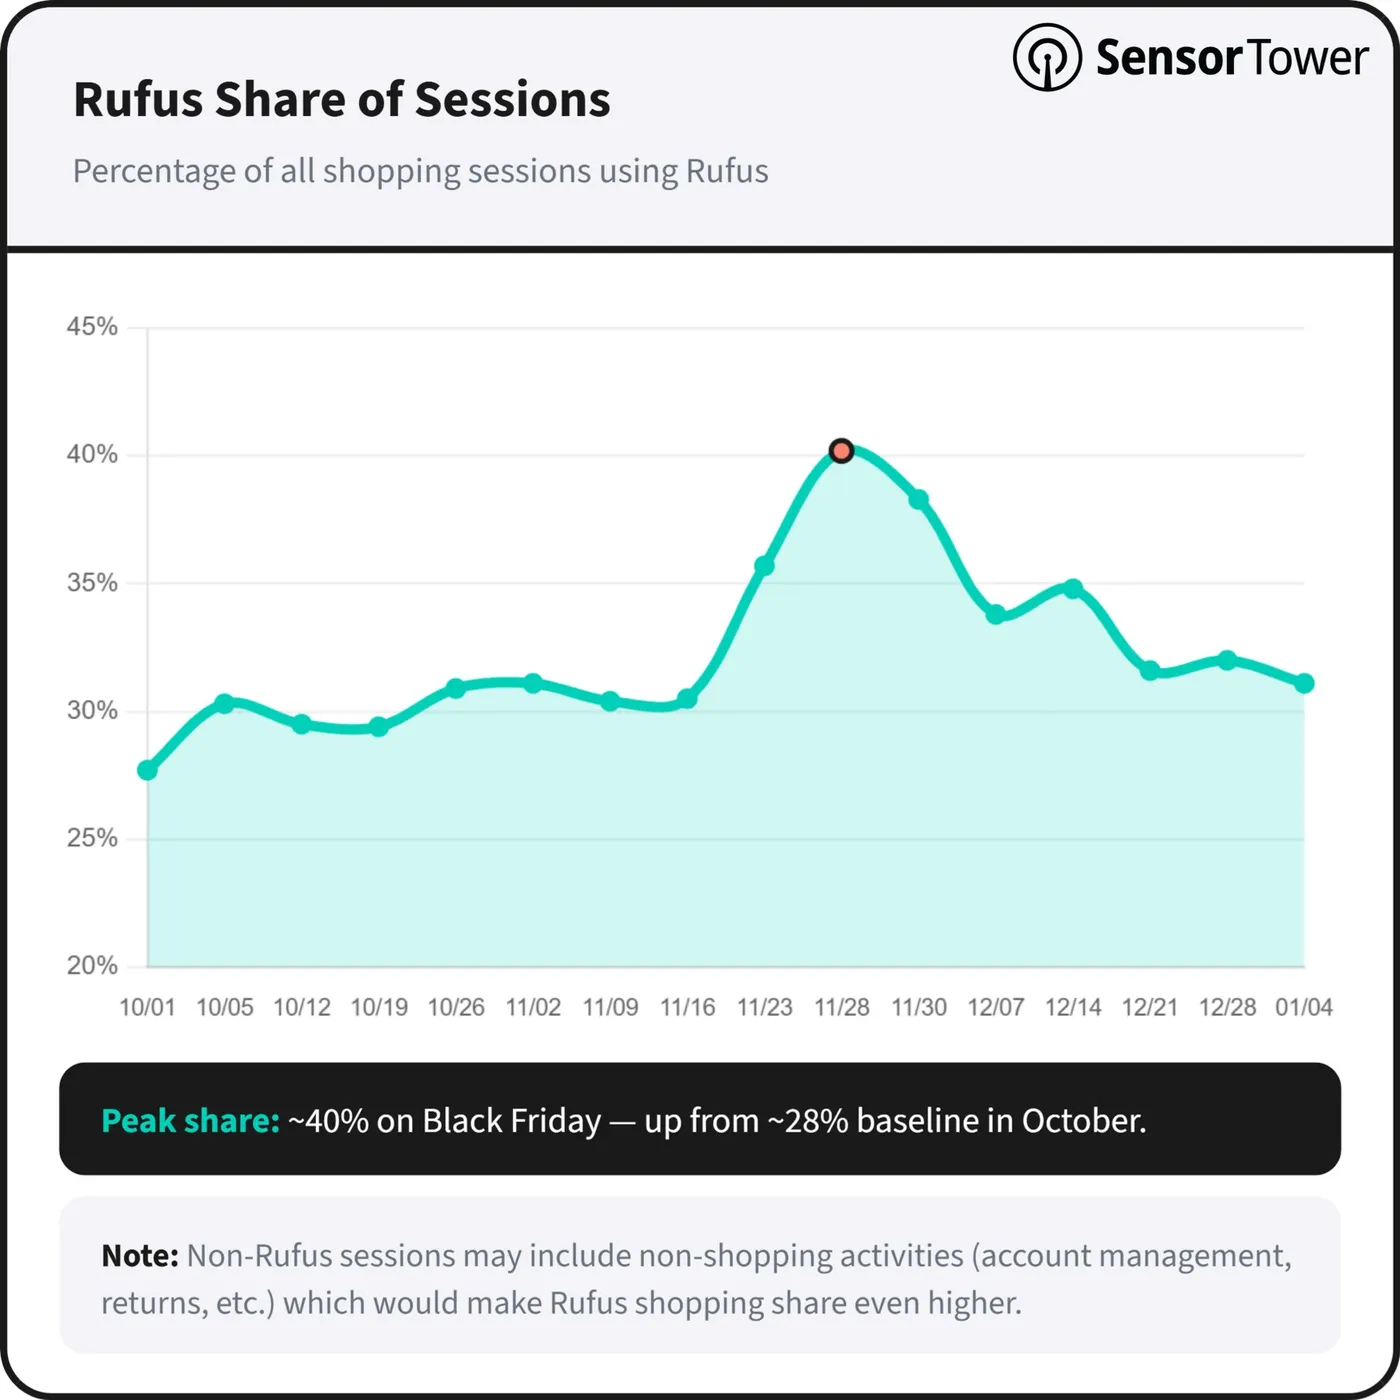
What is not in that post: the "66% of Black Friday purchases" figure, and the "panel of 100,000+ sessions" that the figure is usually attributed to. Neither appears in Sensor Tower's own text, and neither could be traced to any Sensor Tower primary statement. A later Sensor Tower post, in April 2026, discloses a panel of 60,000 US shoppers for a different, non-Black-Friday conversion figure of 2.74x. The "Rufus sessions grew 90% versus 8% for non-Rufus" pair is also absent from Sensor Tower's text — three secondary sources give three different pairs (+90%/+8%, +100%/+20%, +75%/+35%) for what appears to be the same unlabelled chart, which is what chart-reading guesses look like.
The 3.5x conversion figure does have a source: Sensor Tower SVP Ian Simpson, in a February 2026 newsletter interview, describing Rufus sessions converting roughly 3.5x non-Rufus sessions across ten distinct shopping patterns — stated with an explicit correlation caveat. Sensor Tower's own post says the quiet part outright: the jury is still out on how much of Rufus's contribution is spurious correlation versus how much is truly determinative.
It's possible Rufus is simply very good search.
Ian Simpson, Sensor Tower — on his team's Rufus analysis
Amazon's own disclosures are a cleaner record, and they move by quarter. On the Q3 2025 call, Andy Jassy said Rufus had 250 million customers in 2025, that users were about 60% more likely to complete a purchase, and that it was on track to deliver over $10 billion in incremental annualised sales. On the Q4 2025 call (5 February 2026) that became "more than 300 million" customers for the year, with earnings coverage citing nearly $12 billion in actual incremental annualised sales. After the May 2026 rename to Alexa for Shopping, the Q2 2026 call reported more than 350 million customers in the trailing twelve months, interactions up over 5x year over year, and US customers using it spending 40% more per order than non-users. "Incremental sales" there is Amazon's own attribution model, not a GAAP line. And the "3.5x versus a keyword search" claim attached to Rufus in circulation is not a Jassy figure at all — it traces to a separate AWS retailer-facing product.
Retailer-native assistants elsewhere report the same shape. Walmart's CEO John Furner reported Sparky users at 35% higher order value on the February 2026 call, rising to 40% more per order by the August 2026 call as adoption grew roughly 70% year over year. Lowe's CEO Marvin Ellison told analysts customers who engage with its Mylow assistant convert at about 3x those who don't. Every one of these compares people who chose to use a tool with people who did not, and none discloses a control group.
Also to stop putting Walmart's reorder economics into an apparel business case.
Adrian Luna, SVP Growth, Webscale — LinkedIn
Two studies, opposite answers, different baselines
This is the cleanest worked example in the report of why a baseline matters more than a finding.
Study one. Visibility Labs (now 180 Marketing) analysed GA4 data from 94 seven- and eight-figure e-commerce brands over January to December 2025: 9.46 million non-branded-organic sessions against 135,000 ChatGPT-referral sessions, category and product pages only. ChatGPT converted at 1.81% against 1.39% — about 31% higher — and led in 10 of 12 months, with revenue per session 10.3% higher. Average order value ran lower: $204 against $238 for the full year, and the report itself prefers its second-half figure of $208 against $238 as more reliable. The publisher sells AI-visibility services.
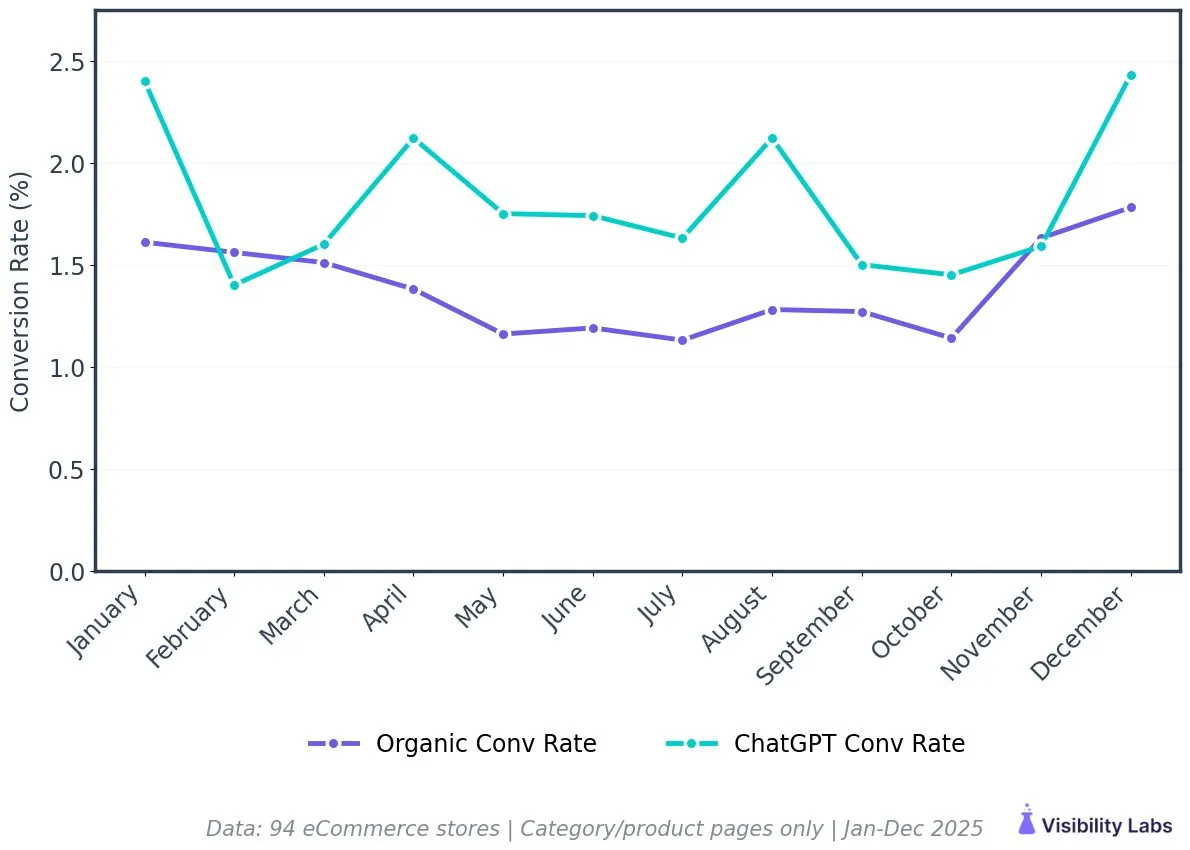
Study two. Kaiser and Schulze's SSRN working paper covered 973 sites and $20 billion of combined revenue from August 2024 to July 2025, comparing 50,000-plus ChatGPT transactions with 164 million transactions from traditional channels. It found ChatGPT converting about 13% worse than organic search overall — and 86% worse than affiliate links specifically. It was not peer-reviewed as of the coverage date.
The likeliest reason they disagree is not sample size. Visibility Labs explicitly strips branded and homepage traffic out of its organic baseline; published coverage of Kaiser and Schulze does not state whether its broader "organic search" bucket includes branded search, and the paper itself could not be fetched to check. Branded organic is the highest-converting traffic a store has. Leave it in the baseline and AI looks worse; take it out and AI looks better. Both studies can be internally correct.
Does ChatGPT traffic convert better? It depends what you compare it with
Conversion-rate difference against each study's own baseline. Same question, opposite answers, because the baseline is not the same traffic — that is the finding, not which study is right.
Show data table
| 180 Marketing · vs non-branded organic · 94 brands, 2025 | 31% |
| Kaiser & Schulze · vs organic search · 973 sites, Aug 2024 – Jul 2025 | -13% |
| Kaiser & Schulze · vs affiliate links · same 973 sites | -86% |
The misquote to stop repeating
The "86% conversion problem" attributed to the Kaiser and Schulze paper is the wrong comparison from the right paper. In that study, 86% is the gap between ChatGPT and affiliate links. The ChatGPT-versus-organic-search gap is about 13%. Anyone citing "the Hamburg study found an 86% conversion problem for AI traffic versus search" has swapped one of the two baselines.
10 July 2026: the shelf moved to the feed
Then the mechanism changed under everyone. Profound analysed 1,757,723 ChatGPT Shopping prompt runs in July 2026 and found the share of product picks it classifies as feed-integrated jumping from 8.26% to 61.54% on 10 July — the day after OpenAI's rollout of GPT-5.6. Concentration followed: references to the top ten stores rose from 22.5% to 41.8% of picks, and the number of unique merchants ChatGPT referenced fell from 13,524 to 10,607, a 21.6% drop. Of 687 merchants Profound tracked closely, 517 saw visibility swings of at least a third — 450 down, 67 up — and a regression relating each merchant's loss of web-search retrieval to its gain in feed retrieval explained 83% of the variance.
July 10 2026: ChatGPT Shopping started answering from product feeds
Measured across 1,757,723 tracked ChatGPT Shopping prompt runs in July 2026. In the same switch, the number of distinct merchants shown fell from 13,524 to 10,607.
Show data table
| Before Jul 10 | After Jul 10 | |
|---|---|---|
| Picks sourced from a connected product feed | 8.26% | 61.54% |
| Share of picks held by the top 10 stores | 22.5% | 41.8% |
This is Profound's own classification of its own customers' tracked prompts, not an audited sample of all ChatGPT Shopping traffic, and OpenAI has not confirmed the shift or attributed it to the release. Read it as the best available reading of one surface, and note which surface: the Shopping product carousel, not ChatGPT's free-text answers. A separate analysis showing that ChatGPT's written recommendations are built from third-party citations rather than catalog data is not in conflict — it is measuring the other surface.
ChatGPT doesn't pull from your product feed. It pulls from whatever it decided to cite.
Kevin Jackson, founder, CatalogIntel.io — LinkedIn
Feels like the old Google Shopping feed wars again, except this time the eligibility line moved after the traffic already shifted, not before.
Javier Torralba, CRO — on ChatGPT Shopping's July feed shift
Both are right, and the practical conclusion is the same: get into the feed and into the sources that get cited. Shopify and Etsy catalogs are integrated with no application needed; other merchants go via a waitlist or an approved feed provider.
Scale does not carry over
ReFiBuy's Q2 2026 AI1000 index, published with Digital Commerce 360 on 18 August 2026, found 972 of 1,000 ranked retailers changed position quarter over quarter, with a median move of 35 spots and 641 retailers moving at least 25 places. The new number one, Nixon, ranks 722nd by online sales, and only 10 of the 100 largest online retailers appear anywhere in the AI1000's top 100. It is a readiness index — bot-friendliness, AI-source traffic, source diversity, momentum — not a sales measure, which is exactly why it can be true at the same time as Apptopia's finding that Amazon took 54% of ChatGPT's retail-app referrals over Black Friday weekend and Profound's finding that answer visibility is concentrating.
On the input side, Adobe's AI Content Visibility Checker scored how much of a retail site's content large language models can actually read, with category averages from 47% (Furniture and Home) to 63% (Cosmetics) — Electronics 56%, Sporting Goods and Apparel 51%, Grocery 48%. Roughly half of a typical retail site is invisible to the thing doing the recommending.
Where shoppers say they start, and how they really move
Bain's 2026 Holiday Shopping Outlook, fielded in August 2026 with 1,105 US online shoppers against a 950-respondent October 2025 baseline, found 24% now say they will start a holiday shopping journey on a gen-AI platform, up from 17% — a multi-select question, and a 7-point rise, which is about 41% relative, not the "50% increase" some posts claim. Amazon went 73% to 71% in the same question; retailer and brand websites 51% to 60%.
Other surveys measure other things and should not be stacked. PwC's Holiday Outlook 2026 (4,093 US consumers, fielded 15–26 June 2026) found 29% plan to use AI somewhere in holiday shopping, up from 22% in 2025 — mostly to research products (76% of those users), compare prices (55%) and stay on budget (25%) — and that in apparel and footwear, 64% use AI for ideas but buy elsewhere. Narvar's August 2026 report found 65% of 1,348 US shoppers plan to use AI for at least one part of their holiday shopping. Google's 2026 holiday guide, drawing on an Ipsos survey of about 14,305 AI-using and 21,881 non-AI-using shoppers across 25 countries, found 61% of US holiday shoppers used AI during their 2025 purchase journey and that those shoppers engaged 12.1 touchpoints against 4.2 for non-AI shoppers.
That last number is worth sitting with, because it contradicts the most common story about this channel. AI does not collapse the funnel. In Google's own data it lengthens exploration. Similarweb's behavioural panel agrees from the other side: when consumers use AI in shopping research, they use search alongside it 89% of the time, and AI-plus-search journeys convert best of any combination.
And almost nobody can measure any of it
PYMNTS Intelligence's Global Digital Shopping Index: Merchant Edition, commissioned by Visa Acceptance Solutions and covering 1,185 retail merchants across the US, Brazil and the UAE, found 23% of merchants can connect AI-driven traffic to the purchases it produces, a further 21% can see the traffic but cannot tie it to a completed sale, and 61% agree AI-generated results will influence purchases more than traditional search. Larger merchants do slightly better than SMBs — 27% against 19%. On the confidence side, Narvar found just 8% of 100 senior retail decision-makers are "very confident" using AI to improve the shopping experience.
Some of the gap is not the merchant's fault. Similarweb's clickstream study of AI-recommended brands found consumers were 2.5x more likely to visit a recommended brand's site within seven days — and that 55.9% of that downstream traffic arrived as ordinary branded search, not as a click from the AI platform. Most AI influence is already invisible in referral reporting by construction. Last-click will keep understating this channel no matter how carefully you tag it.
Split AI referrals out in GA4 and compare them with non-branded organic
Not with all organic. Branded search in the baseline is the single biggest reason two credible studies reach opposite conclusions about the same channel.
Get feed-eligible before October
GTINs, complete attributes, correct variants, live price and stock — in Merchant Center and in whatever pipe reaches ChatGPT Shopping. After 10 July 2026, feed-sourced picks went from 8.26% to 61.54% of ChatGPT Shopping product results.
Run a fixed prompt panel and keep the sheet
Twenty to thirty real buying questions per key category, across the assistants your customers use, re-run fortnightly. Log which brands are named and whether your specs and prices are right. A single prompt on a single day is noise.
Work the sources the models cite, not only your own pages
Feed access earns you a product card. Comparison articles, review media and category publications earn you the sentence above it.
Build the business case on your own category
The biggest basket lifts come from categories people rebuy. In apparel and footwear, PwC found 64% of AI users take the idea and buy elsewhere.
Expect the channel to be under-credited, and plan anyway
55.9% of AI-influenced visits in Similarweb's panel arrived as branded search. If you wait for last-click to justify the work, you will do the work late.
AI-referred traffic growth to US retail sites: Black Friday 2025, Cyber Monday 2025, and the full Nov 1 – Dec 31 2025 season. Adobe's own note: the base of users remains modest.
First-party / research Adobe Analytics · recap
Share of ChatGPT Shopping product picks sourced from integrated merchant feeds, in one day, 10 July 2026, across 1,757,723 tracked prompt runs.
First-party / research Profound · analysis
Rufus's share of Amazon mobile-app sessions on Black Friday 2025, up from 30% on 1 November and easing to 38% by month-end. The "66% of purchases" figure is not in Sensor Tower's post.
First-party / research Sensor Tower, Dec 2025 · analysis
Merchants who can connect AI-driven traffic to the purchases it produces, versus those who see the traffic but cannot tie it to a sale. 1,185 retail merchants, US / Brazil / UAE.
First-party / research PYMNTS Intelligence, commissioned by Visa Acceptance Solutions · report
The summary for a P&L is narrower than the discourse. AI discovery is not yet a volume channel for most stores, and treating it like one is how a quarter gets wasted. It is where the comparison step now happens for a growing minority of high-intent shoppers, it is measured badly by every tool you own, and its rules changed in a single day this July with no notice. The work it rewards — a clean feed, consistent product facts, third-party coverage, and analytics that separate it out — is work that pays across every assistant and survives the next reshuffle.
Chapter 09
Agentic commerce: what is live, what died
A year of announcements produced one consumer-facing checkout inside a chatbot, and it was switched off. What survived is plumbing: protocols, card rails, agent-identity schemes and merchant-owned checkout at the end of an AI conversation. For BFCM 2026 the working model is still "the agent finds it, the human pays on your site" — and the ceiling on that is not technical.
What holds up
- OpenAI launched Instant Checkout in ChatGPT on 29 September 2025 with Etsy first and Shopify merchants following, charging a 4% merchant transaction fee. It wound the feature down in March 2026 — reporting broke around 5–6 March, OpenAI's own pivot post published 24 March — replacing it with product discovery that routes purchases to merchants' own checkout.
- The claim that it was "rolled back after a month" is wrong. The wind-down came roughly five to six months after launch.
- Walmart EVP Daniel Danker said checkout completed inside ChatGPT converted at about one-third the rate of sending the same shoppers to Walmart's own site.
- The protocol survived the product. OpenAI's Agentic Checkout Spec is still live, and Visa reports 100+ ecosystem partners, 30+ building in its sandbox and 20+ agents integrating directly with Intelligent Commerce.
- The ceiling is consumer permission. Across five 2026 studies, comfort with an AI completing a purchase runs from 9% to 32%, and 72% are comfortable with AI help only if they keep the final call.
The year in one product's lifecycle
Instant Checkout is the cleanest test anyone ran of buying inside a chatbot. It launched on 29 September 2025 on the Agentic Commerce Protocol, built with Stripe, single-item checkout only, Etsy sellers first with Shopify merchants to follow, at a 4% merchant fee. Reports vary on how many Shopify merchants ever went live — roughly 12 to 30 depending on source and date — which is itself the finding: after the loudest product launch in commerce, the live merchant count was countable.
By March 2026 OpenAI had wound it down and moved to a discovery experience that hands the purchase back to the merchant's own checkout. The most useful public explanation came from the largest participant: Walmart's EVP Daniel Danker said in-chat checkout converted at about a third the rate of sending the same shoppers to Walmart's site to finish. Whatever friction the buy-button was supposed to remove, it removed less than the trust and familiarity of the merchant's own flow.
My read is that the money in AI shopping was never going to be in owning the checkout.
Andrew Vlasov, CEO, LookFresh.ai — on OpenAI winding down Instant Checkout
What is actually live going into BFCM 2026
The protocol layer outlived the consumer feature. OpenAI's Agentic Checkout Spec remains a live, published spec even though the buy-button was discontinued for most merchants — an important distinction that one-line summaries flatten into "OpenAI quit agentic commerce".
On the payments side, Visa's Intelligent Commerce reports more than 100 ecosystem partners worldwide, over 30 actively building in its sandbox and over 20 agents or agent enablers integrating directly, and Visa states it "predicts that millions of consumers will use AI agents to complete purchases by the 2026 holiday season". That is a company's hedged forecast about its own product category. It has already been restated in circulation as "by Black Friday 2026, millions will rely on AI agents to handle checkout" — a different sentence. Separately, Visa's Business-to-AI report with Morning Consult (fielded 29 January – 6 February 2026, 512 US business decision-makers) found 53% would allow AI agents to negotiate prices or terms directly with other AI agents on their behalf, which is a B2B appetite finding, not a consumer one.
On the merchant-agent side, Anthropic published its Claude Commerce Agents blueprint on 2 September 2026 — an Apache-2.0 reference implementation, with Shopify and Priceline named as users — and its launch post states that retailers running shopping agents on Claude "have seen carts up to 35% larger and shoppers 60% more likely to complete a purchase". Anthropic's head of product for the Claude platform subsequently clarified to trade press that the cart-size figure reflects results from one unnamed retail partner and is explicitly not an industry-wide average; no sample size, baseline, period or methodology is disclosed anywhere for either number. It has nonetheless been restated as a general result for "retailers" within days of launch. The blueprint itself stops at cart handoff: the checkout is still yours.
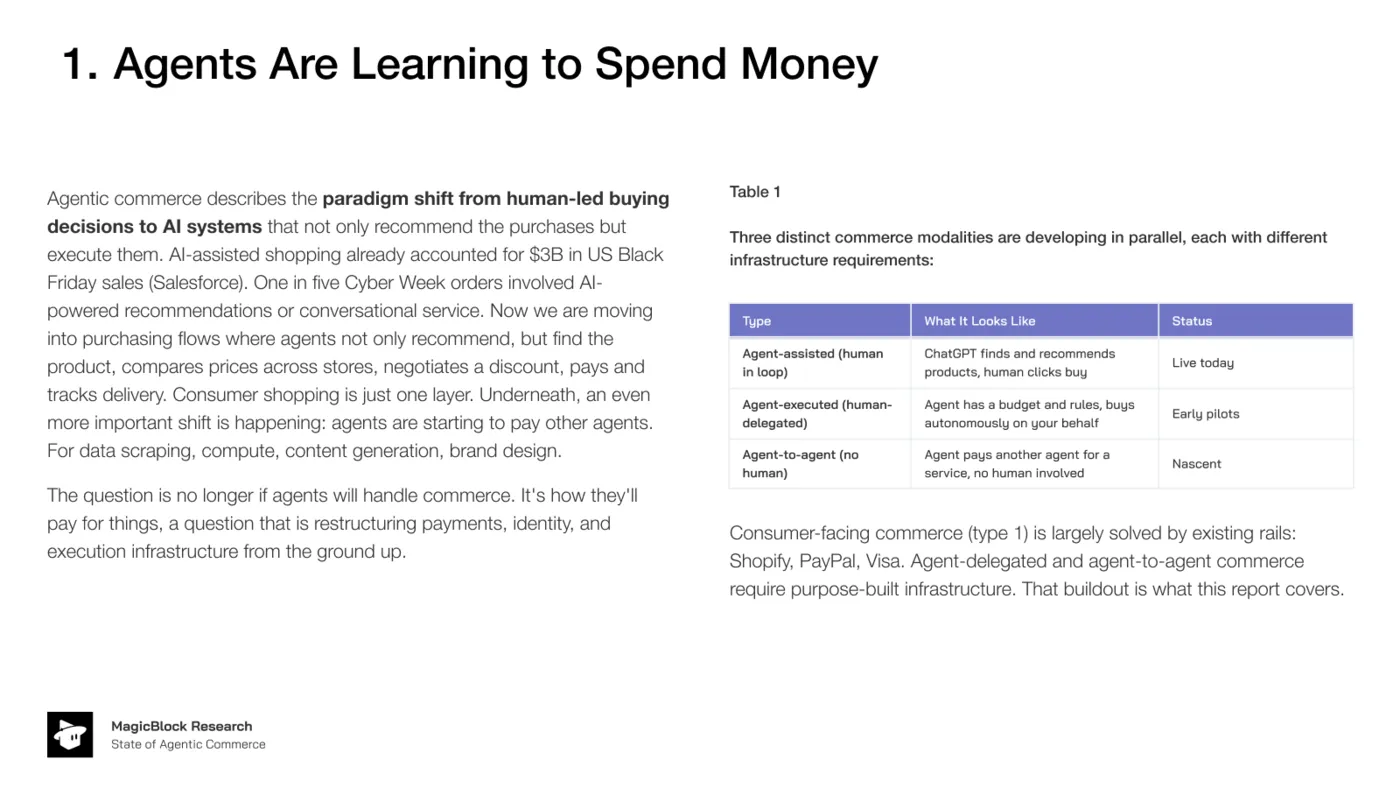
That three-tier frame is the right one to plan against. Agent-assisted — the agent finds and compares, the human confirms — is live today and is where essentially all real volume sits. Agent-executed — the agent buys within rules the user set, such as a price-drop auto-buy — exists in narrow pilots. Agent-to-agent, software paying software with no human on either side, is nascent and, on the available evidence, mostly not real yet.
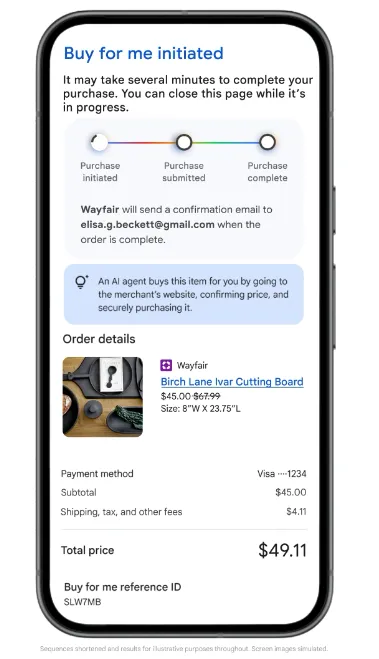
The crypto rail, and why its numbers should not be quoted flat
x402, the HTTP-level micropayment scheme, is the most-cited example of agent-to-agent payment and the least measurable thing in this report. MagicBlock Research's March 2026 report "The Agent Economy" states that x402 volume collapsed 92% between December 2025 and February 2026, and puts the largest agent-to-agent marketplace it cites, Virtuals Protocol, at about $2.63 million of agent revenue in January 2026 across 1.77 million-plus completed jobs. Those are that report's own figures, verified against the report — and this report's evidence ledger marks the underlying volume claim unverified, for a specific reason.
Independent trackers of the same December 2025 30-day window disagree by more than tenfold: x402.org around $24 million, Allium around $3 million, Artemis under $2 million. And analysts at Artemis and a16z flag roughly 48% of transactions and 81% of volume in that period as gamed or wash volume. A 92% collapse measured on a base where four-fifths of the activity may be self-dealing is not a market signal. The honest statement for an operator is that nobody can tell you the size of agent-to-agent payment volume, including the people reporting on it, and that both the bullish and bearish numbers in circulation come from inside the crypto ecosystem.
The trust ceiling is the real constraint
Five separate 2026 studies, different samples and different countries, land in the same band. ChannelEngine's Marketplace Shopping Behavior Report (4,500 shoppers across the US, UK, France, Germany and the Netherlands, published 7 January 2026) found only 17% comfortable completing a purchase through AI. Ipsos found 27% of AI-aware consumers use AI for product research against 9% who would allow autonomous AI purchases. Syndigo's State of Product Experience 2026 (8,736 consumers across six countries, June 2026) found 32% have or would let an AI agent buy on their behalf. Accenture's grocery research found about a third would let an agent finalise a purchase decision but only 9.5% want fully hands-off buying. And The Harris Poll's Algorithmic Aisle study (3,222 adults across the US, UK, Brazil and India, June 2026) found 72% comfortable with AI helping only if they make the final call.
People will let AI help. They will not let it pay.
Five different surveys, five different samples, five different question wordings. Read the shape of the drop, not the exact points.
Show data table
| Comfortable with AI helping — if they make the final call (Harris Poll) | 72% |
| Have let or would let an AI agent buy for them (Syndigo) | 32% |
| Use AI for product research (Ipsos, AI-aware consumers) | 27% |
| Comfortable completing the purchase through AI (ChannelEngine) | 17% |
| Currently allow autonomous AI purchases (Ipsos) | 9% |
The same Harris study explains part of why. 78% of consumers assume brands pay to be recommended by AI, and 45% want AI platforms to disclose paid or sponsored recommendations — 52% in the UK, where 38% want no AI involvement in shopping at all. A shopper who assumes the recommendation is bought will not hand that system their card. It is a trust problem, and a better checkout API does not solve it.
Because we may be getting closer to securing the transaction. I'm not convinced we have fully secured the intent.
Joel Czuba, payments commentator — LinkedIn
The 20% number, and what it counts
Salesforce's 2026 holiday predictions, published 20 July 2026, forecast that 20% of all 2026 holiday ecommerce traffic will come from AI chat agents, and that one in three ecommerce sites will have a branded shopper agent live by Cyber Week 2026. Read Salesforce's own definition before using the first number: it counts consumer-facing chatbots, autonomous backend agents and competitor price-scraping bots. It is not a forecast of 20% human shoppers arriving through assistants. Salesforce also reports that retailers who ran their own branded shopper agent grew 2025 holiday sales 6.2% against 3.9% for those who did not — a 59% faster relative growth rate, not 59 percentage points, and not a controlled comparison.
The bot framing matters because the traffic arrives whether or not it buys. Akamai found that 47.9% of all AI-bot traffic on its network between July and December 2025 hit the commerce vertical — the share of AI-bot traffic landing in commerce, not the share of commerce traffic that is bots, which is how it is usually misquoted. Radware found bad bots at 43% of e-commerce traffic during the 2025 holiday season, up from 31%, against 46% from human shoppers. The question has moved from "bot or not" to which agents you allow, at what rate, doing what — and agent-signing rails prove the platform, not that a human authorised this purchase.
The 2030 forecasts, and their spread
Four firms have sized this market and they are not measuring the same thing. McKinsey (October 2025) put agentic commerce at $3–5 trillion globally and up to $1 trillion of US retail revenue by 2030. Morgan Stanley (9 December 2025) put US agentic e-commerce at up to $385 billion, 10–20% of US online spend. Bain (17 December 2025) forecast $300–500 billion, or 15–25% of US e-commerce. Deloitte says agents could influence — not complete — up to 25% of global e-commerce sales. That is roughly a 25x spread, produced by different geographies and three different verbs: influenced, orchestrated, completed. All four are scenario-sizing exercises, not measured outcomes.
Without a denominator, a transaction count is evidence of activity, not reliability.
Thyris.AI, Agentic Commerce Newsletter
Plan for agent-assisted, not agent-executed
The one at-scale consumer test of in-chat checkout was withdrawn, and the largest participant reported roughly a third of the conversion of its own site. Make the handoff to your checkout fast and familiar rather than betting on being bought inside a chat window.
Write an explicit agent-access policy before peak
Decide which agents you allow, verify them through the signing rails your processor supports, set rate limits, and detect intent at journey level. Blocking everything and blocking nothing are both decisions; only one of them is usually made deliberately.
Pressure-test catalog, stock, price and returns APIs for agent-scale querying
Agents query hard and retry, and an agent that recommends an out-of-stock item costs you the sale and the trust. This is infrastructure work with a deadline, not a strategy debate.
Treat every vendor lift number as one unnamed partner until proven otherwise
The headline "carts 35% larger, shoppers 60% more likely to convert" is one retailer, per the vendor's own head of product. Ask for the sample before it enters your business case.
Assume the shopper wants the final click
Comfort with an agent completing a purchase sits between 9% and 32% across every 2026 study available, and 72% want the final say. Design the agent experience to end in a confident human decision, not to remove one.
OpenAI Instant Checkout, launch to wind-down: 4% merchant fee, Etsy first, roughly 12–30 Shopify merchants live. Not "rolled back after a month" — five to six months.
Named, secondhand OpenAI spec + CNBC/PYMNTS reporting · spec
Consumers comfortable completing a purchase through AI — 4,500 marketplace shoppers across the US, UK, France, Germany and the Netherlands, January 2026. Other 2026 studies land between 9% and 32%.
First-party / research ChannelEngine · report
Consumers who assume brands pay to be recommended by AI, and who want paid or sponsored AI recommendations disclosed (52% in the UK). 3,222 adults, US/UK/Brazil/India, June 2026.
First-party / research The Harris Poll · study
Salesforce's forecast share of 2026 holiday ecommerce traffic from AI chat agents — its own definition includes consumer chatbots, backend agents and competitor price-scraping bots.
First-party / research Salesforce, 20 Jul 2026 · predictions
One year in, the scoreboard is short. A protocol layer that works, a payments layer that is being built faster than anyone is using it, one consumer checkout experiment that failed against the merchant's own site, and a consumer permission ceiling that no integration removes. For BFCM 2026 that means the agentic work worth doing is not a buy-button. It is being legible, in stock, priced correctly and fast to hand off — which is the same work that pays whether or not any of this arrives on schedule.
Chapter 10
AI inside the brand
The best-attested AI numbers in this report come from Meta's own earnings call, and they are small: three and a half percent here, three percent there. The largest ones come from vendors describing their own launch partners. Most of what you need to decide before November sits in the gap between those two facts.
What holds up
- Meta, Q4 2025 earnings call: GEM plus sequence learning drove +3.5% Facebook ad clicks and >1% Instagram conversions; a new runtime model +3% conversion rate; the latest incremental-attribution rollout +24% incremental conversions versus the standard model.
- The one use case here with a named brand, a named publication and a before-and-after: Dr. Squatch, via AfterShip, 25% fewer "where is my order" tickets.
- E-Commerce Bench, a simulated-store benchmark from the Qwen team: 10 of 90 year-long agent runs ended in bankruptcy.
- PYMNTS Intelligence: only 23% of merchants can connect AI-driven traffic to a purchase.
Three places it is already paying
Strip out the launch posts and the same three jobs keep appearing: narrow, unglamorous, sitting on data the brand already owns. Support at peak. Digital Commerce 360 reported on 2 September 2026 that Dr. Squatch, using AfterShip's AI post-purchase agent, cut "where is my order" tickets by 25%, hit 94% on-time delivery-date accuracy and saw a 31.89% click-through rate on tracking-page recommendations. Check the periods: those three describe Q1 2026, not BFCM. The BFCM-specific figures are a 99.83% delivery-completion rate and shipment volume up 62.69% month over month through Cyber 5 2025. Vendor-supplied, one brand, not a benchmark.
Sierra published one BFCM number for its customer Minted: a 387% month-over-month increase in conversation volume absorbed by the agent over BFCM 2025 — with no containment rate, resolution rate or CSAT beside it. Absorbing volume and handling it well are different claims; only one was measured in public.
Monitoring, not acting. The second pattern is an agent that watches spend, stock and page health and tells a human. Triple Whale's own BFCM 2025 recap says Moby and its agents handled nearly 25,000 real-time questions across five languages that weekend — a platform-wide total across a base the same company puts above 50,000 brands. Under one question per brand: a feature sampled, not a category adopted.
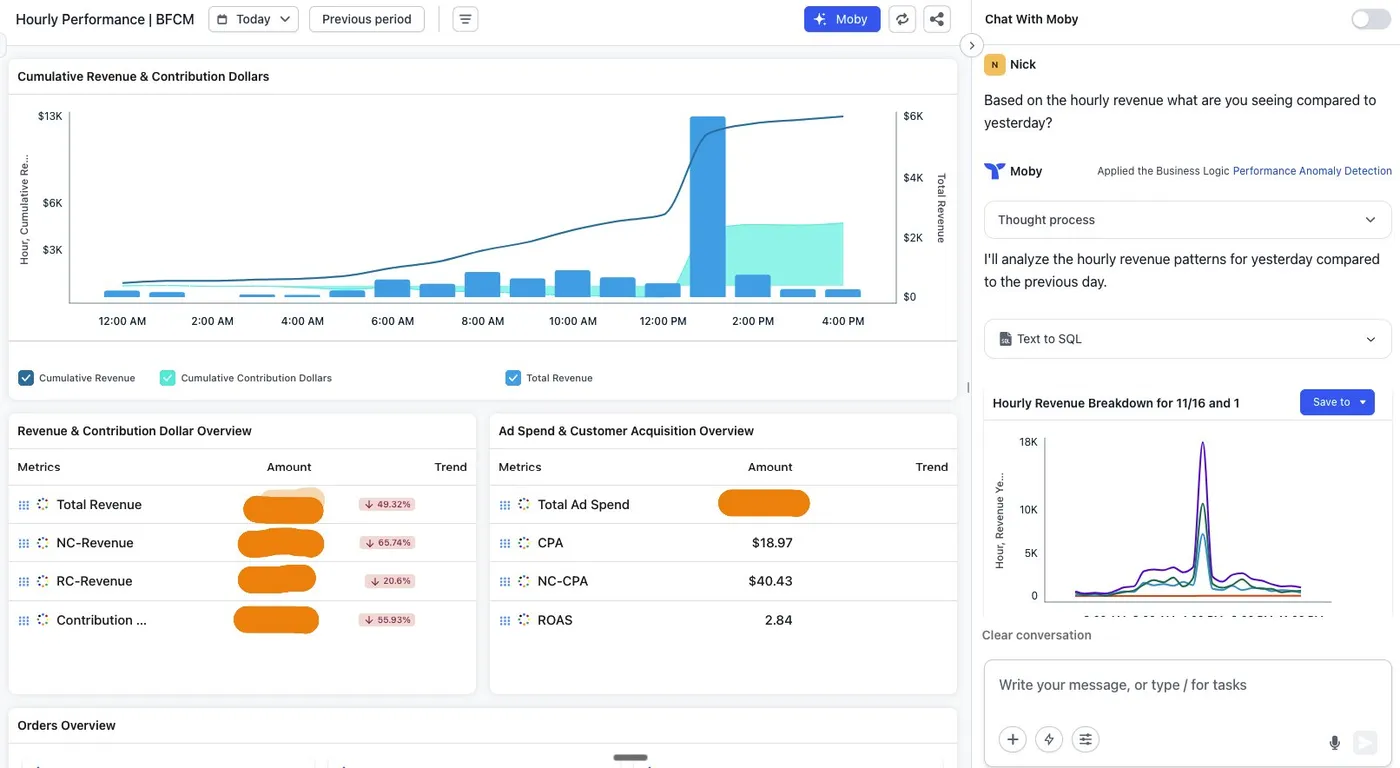
AI-drafted email under human QA. Klaviyo's 2 December 2025 release reports 22.7 billion messages over BFCM 2025 (up 25% year over year) and more than $3.8 billion in Klaviyo Attributed Value (up 27%), with use of its AI product recommendations up 45% and revenue from those messages up 71% year over year. Two caveats ride with that 71%: it compares AI-recommendation revenue with last year's, not with non-AI messages, and KAV is Klaviyo's own window — orders within five days of an email open or click, 24 hours for SMS. Not audited incrementality.
The model doesn't know where the product block goes or where the discount module sits, and an update can change the way it writes overnight.
Mark Mei, founder of a retention agency — the productivity figures in the same post could not be traced to any source and are not used here
The best-attested numbers here are Meta's, and they are small
On 28 January 2026, Meta management put four AI results on the record on the Q4 2025 earnings call. Named company, dated disclosure, specific system, audited filing next door — and modest.
Meta's own AI gains are single digits — except where it changed the ruler
Platform-wide results Meta reported for its ad systems in Q4 2025. The top row is not a revenue lift: it is how many more conversions the new attribution model counts.
Show data table
| Conversions counted by the new incremental-attribution model, vs the standard one | 24% |
| Facebook ad clicks (GEM + sequence learning) | 3.5% |
| Instagram conversion rate (new runtime model: Feed, Stories, Reels) | 3% |
| Instagram conversions (GEM + sequence learning) | >1% |
These are Meta's own production systems across Facebook and Instagram in Q4 2025, self-reported, no per-advertiser or per-vertical breakdown. Taken at face value they set a ceiling: the largest platform-side AI gain a company with Meta's data and engineers would state publicly is 3.5% more clicks. The 24% is bigger but measures something else — how many more incremental conversions a new attribution model credits, not how many more sales happened. A better ruler is not a better result.
Hold 3.5% next to a deck promising 10x. If the platform that owns the ranking model gets single digits from a year of frontier work, a bolt-on agent will not double your business. It may still be worth buying — for the labour it removes, not the revenue it invents.
What agents do when nobody is watching
The most useful failure evidence in this corpus is not a case study but a benchmark. In E-Commerce Bench (Qwen team, arXiv:2608.30730, 31 August 2026), 18 frontier models each ran five independent 365-day store episodes in a deterministic simulated marketplace: 90 runs in all.
Left to run a store for a simulated year, agents go broke and never haggle
18 models × 5 episodes = 90 simulated 365-day runs, with fixed demand and negotiation kernels. A simulation, not real stores.
Show data table
| Models that never bargained a repeat price down (16 of 18, over 8,647 repeat purchases) | 88.9% |
| Simulated runs that ended in bankruptcy (10 of 90) | 11.1% |
Ten of the 90 ended in bankruptcy. The top-earning model ranked 16th of 18 on money spent with fraudulent suppliers — earning well and buying badly at once. And across 8,647 repeat purchases from the same honest supplier, 16 of the 18 models showed no clear sign of pushing the price down over the year: same thing, same counterparty, hundreds of times, and never a better deal asked for.
Say the disclaimer out loud: this is a simulation, with deterministic demand and negotiation kernels. No real store lost money, five episodes per model is thin, and the live leaderboard covers more models than the paper — do not quote it as the paper. What it shows is not "agents lose money" but the failure shape that appears when one runs unsupervised for a long time. Not dramatic errors: a slow absence of judgement. No dashboard flags a supplier relationship that never improved.
Vendor claim, operator evidence
On 2 September 2026 Anthropic published a commerce-agent blueprint opening with: "Retailers running shopping agents on Claude have seen carts up to 35% larger and shoppers 60% more likely to complete a purchase." No partner, no sample, no baseline, no method. Trade press quoting Angela Jiang, Anthropic's head of product for the Claude platform, then clarified that the roughly 30–35% cart figure came from one partner and was explicitly not an industry-wide average. Coverage of the 60% is less consistent. Note also what the blueprint does: the agent builds the cart, checkout still happens on the retailer's own site. Nobody's assistant is paying you.
The same shape runs through the tooling category. Triple Whale's own materials confirm brands on its platform generated $2.88 billion over the BFCM 2025 weekend, 19.7% of all Shopify merchant BFCM sales — a real number that sizes a customer base, not an AI feature's effect. The count of "BFCM agents" given by that vendor's co-founder and paid partners ranged from 3 to over 100, and no such figure appears in any Triple Whale release; that claim did not survive checking.
Underneath sits a measurement problem nobody sells a fix for. PYMNTS Intelligence, in a merchant survey commissioned by Visa Acceptance Solutions, found 23% of merchants can clearly identify both AI-driven traffic and purchases, and another 21% can see agentic traffic but cannot tie it to a completed order. Narvar's 2026 Holiday Shopping Report — 1,348 consumers and 100 senior retail decision-makers, 24 August 2026 — found 65% of shoppers plan to use AI for at least one part of holiday shopping, against 8% of retailers "very confident" in using AI to improve the experience. Both surveys were paid for by companies selling into the gap they describe. The gap is real anyway.
What to do about it
Buy AI for hours, not for revenue
Meta got 3.5% from its own ranking model. Price any AI purchase against the labour it removes — tickets deflected, reports not written — and treat revenue lift as upside you still have to prove.
Put an approval gate on anything that touches money
Budget moves, price changes, published ads, purchase orders. Advisory agents earn their place at peak; acting agents need a named human who gets paged at 2 a.m. and a hard cap on what one action can cost.
Demand the denominator before you sign
Questions answered and conversations absorbed describe activity. Ask for containment, resolution and CSAT, with the period each covers — then check those periods match, as they did not in the Dr. Squatch case.
Set the baseline in October, in writing
Record the metric and the date before you switch anything on. Platform AI changes under you, so a baseline reconstructed afterwards is not one.
Pressure-test the data, then freeze it with everything else
Catalog accuracy, stock sync at agent query volume, a knowledge base cleaned before any bot is pointed at it — every customer-facing failure here was a data failure wearing a model's clothes. And if an automation is not in production by mid-October, it does not run this peak. A freeze that exempts "just a prompt change" is not a freeze.
Chapter 11
After the sale
The returns wave did not get bigger in 2025. It got sharper, and it moved into the week your team is away. Then the disputes arrive, a month or three later, against revenue you already counted.
Returns: same volume, worse timing
Adobe Analytics' final figures for the US 2025 holiday season — Nov 1 to Dec 31, across its e-commerce transaction tracking — show overall returns down 1.2% year over year. On its own, good news.
The second figure is the one that changes a staffing plan. Returns in the 26–31 December window were up 4.7% year over year, and roughly one in seven of the season's returns landed in those six days, against about one in eight in 2024. A flat season is concentrating into the days between Christmas and New Year, when warehouses run skeleton shifts and the people who know the SKUs are on leave.
Quote the right one: an earlier Adobe reading of −2.5% covered Nov 1 to Dec 12 only, and so excludes the spike above.
Returns are not only a cost line, they are a retention event. Ryder System's 2026 e-commerce consumer study, 1,160 US online shoppers surveyed in March 2026, found 79% of shoppers who had a bad returns experience stopped shopping with that brand. You paid peak CAC for that customer four weeks earlier.
Some of the volume is avoidable before it happens. A field experiment on Instacart covering more than 840,000 customers (Knight and Mitrofanov, Management Science) found that disclosing low product availability honestly produced a 3.7% reduction in refunds and a 2.9% reduction in replacements, alongside 5.7% higher long-run order frequency and 5.8% higher spending. Telling people the truth about stock cost nothing and shrank the thing you pay to process in January. A 2.6% version of that refund figure circulates secondhand; the study says 3.7%.
The disputes arrive after the quarter closes
Chargebacks and refund abuse land 30 to 90 days after the sale, which means BFCM disputes hit in February and March against a P&L you closed in January. That timing is the operational fact worth planning around. The numbers attached to it here — 1–2% of BFCM revenue lost, $240 of total cost per $100 disputed, $125 billion a year of "digital shoplifting" — come exclusively from sponsored posts by one chargeback vendor running a giveaway, and none could be independently sourced. Pull your own dispute rate from your processor instead.
What is independently sourced is the pressure behind it. Veriff's Identity Fraud Report 2026 puts the e-commerce net fraud rate at 19.2% of verification attempts in 2025, about five times the global average across its platform. Radware's 2026 E-Commerce Bot Threat Report found bad bots at 43% of e-commerce traffic during the 2025 holiday season, up from 31% a year earlier.
Q5 is cheaper, but check the claim you were sold
The window from 26 December to roughly mid-January — gift-card redeemers, resolution buyers, self-gifters — is real, and media is cheaper in it. Strike Social's ad-cost analysis puts the most expensive days of the year at 7 to 10 days before Christmas Eve, with Halloween week running 15–34% below the Black Friday-to-Cyber Monday window. Costs fall away after the 25th.
The number that travels with Q5 advice — that it delivers 20–30% incremental revenue — is attributed to a Meta summit slide photographed from the audience. It could not be confirmed from any public source, and the slide's own footnote marks the underlying data as UK/EMEA 2023–24. Treat Q5 as a cheap window worth planning for, not a percentage you can forecast against — and note that even the window is a convention, ending variously at 10 January, 15 January or mid-January depending who is describing it.
January cash is not yours yet
Northbeam's Cyber Week 2025 recap, across its DTC customer base, reports ad spend up just over 9% year over year, revenue up more than 13%, and first-time customer CAC up about 8%. Klaviyo's BFCM 2025 data shows repeat-buyer revenue growing 13.5% against 9% from new buyers. Both point the same way: the expensive customers are the new ones, and whether they were worth it is settled after the returns clear, not on 1 December.
What to do about it
Staff 26–31 December like a second peak
One in seven of the season's returns arrives in six days. Book warehouse and CX cover for that window in October, when it is a rota question rather than an emergency.
Do not report a BFCM result until returns clear
Reconcile net revenue after returns and the full cost stack — COGS, freight, 3PL, fees, discounts, agency, tool creep — before anyone forecasts off the gross number. In the same pass, check what share of BFCM buyers bought again by March.
Reduce returns at the product page, not the returns portal
Honest stock and availability disclosure measurably cut refunds in a controlled experiment. Sizing detail, real photography and post-purchase education on how to use the product do the same work earlier.
Get your own dispute rate before February
Pull the actual chargeback rate and per-dispute cost from your processor, reserve against it, and ignore the vendor statistics circulating on this topic — none of them survived checking.
Write the Q5 plan in October
Creative that shifts from gifting to self, a list segment for gift-card redeemers and holiday traffic, and a budget already reserved. Improvised on 27 December, the cheap window is just quiet.
Chapter 12
The numbers that don't survive checking
Three hundred and eleven numbers came out of this corpus. Two hundred and ten were checked against a primary source. Thirty-eight of those did not survive, and a further set survived only after correction. Almost none of them were fabricated. They broke in eight repeatable ways, and once you can name the eight you can check a claim in about ninety seconds.
This chapter is not an accusation. Most of the failures below came from people relaying something in good faith: a real study, a real company, a real number — attached to the wrong period, the wrong population or the wrong verb. They are named specifically because every one is still circulating, and the same eight shapes will produce next year's crop.
| Pattern | What circulated | What checking found |
|---|---|---|
| Forecast quoted as actual | Adobe: $761M of Buy Now Pay Later spend on Black Friday 2025 | $761.8M was Adobe's October 2025 pre-season forecast. The actual, reported after the day, was $747.5M, about 6.3% of Black Friday digital sales. Adobe's season BNPL total ($20.0B, +9.8%) and record Cyber Monday ($1.03B) check out exactly. |
| A category figure quoted as platform-wide | TikTok Shop US 2025: $14.4B, 702M items, $20.43 average unit price, Medicube the #1 shop | Charm.io's item count, unit price and Medicube's $98.9M are beauty and personal care only — 147M items at $18.57, and Medicube is the top beauty shop, not the top shop. No source gives exactly $14.4B: Charm.io says "more than $14 billion", other trackers up to $15.8B. |
| "Planned to" rewritten as "will" | Adobe: 72% used AI for research, 47% for recommendations, 43% for deals | No Adobe wave carries those four numbers. Adobe's October 2025 survey of 5,000+ US consumers asked what people planned to do: 53% research, 40% recommendations, 36% deals, 30% gift inspiration. Intent, before the season, not recall after it. |
| Two studies spliced into one | "AI ads win clicks, human ads win sales": CTR 0.76% vs 0.65%, conversion down 8% over $100 and 14% over $500 | The CTR pair is real, from the Taboola/Columbia/Harvard/CMU/TU Munich study of 500M+ impressions — which concluded AI and human ads perform comparably after controls, with no conversion penalty. The price-tier figures come from an unrelated AdBeacon benchmark of ~50,000 ad variations. Combined, they produce a finding neither study supports. |
| Percentage points sold as relative change | Bain: 24% will start shopping on AI platforms, "up 17% from 2025" | 17% was the 2025 level, not the growth rate. Bain's Consumer Lab Holiday Survey (US, n=1,105 in 2026, n=950 in 2025) moved 17% → 24%: a 7-point rise. The same clause also got attached to Deloitte's forecast, which never published it. |
| A plural hiding one partner | Anthropic: "retailers running shopping agents on Claude have seen carts up to 35% larger and shoppers 60% more likely to complete a purchase" | Anthropic's post names no partner, sample or method. Trade press quoting its head of product for the Claude platform reported the ~30–35% cart figure came from one partner, explicitly not an industry-wide average. Resharers then wrote "retailers"; one rewrote the 60% into a "60% lift in purchase rates". |
| Numbers that live behind an email gate | Particl, ~1,000 brands: 20–30% off converts the same as 40%+; optimal promo count ≈5 | The report exists; its PDF sits behind an email form and its public page carries none of these figures, so method, sample and period cannot be checked. It reached this corpus via a disclosed paid advocate. Same with RETHINK Retail's "State of US Omnichannel 2026" (11% revenue gap, 1 in 5 orders returned, 70%+ restricting free returns), which could not be located at all. |
| Verbatim claims from unrelated accounts | "347 Black Friday ads in 48 hours, $49 vs $500 per video" | Posted in identical wording by two unrelated accounts three months apart, November 2025 and February 2026. Identical copy from strangers is a template, not two measurements. |
Where these come from
Four of the eight are period or population errors, and those are the dangerous ones, because the number itself is correct. Nobody invented $761M; somebody read the forecast release instead of the results one. Nobody invented the 0.76% click-through rate; somebody set it beside a conversion figure from a different dataset and let the layout imply a relationship. Right digits, wrong label, passes every smell test a busy operator has time for.
Survey figures are where population errors do the most damage, because the headline is always a percentage of somebody. "77% will use AI to shop this holiday" is PayPal and Talker Research, and accurate — among 1,000 US adults who had already used or considered AI for a purchase in the past year. Zeta Global's 83% is among weekly AI users. KPMG's 15% is a UK panel of 3,000, quoted in lists of US figures. Across eight named surveys here, stated holiday AI adoption runs from 13% to 77%, every number defensible on its own terms. None is the adoption rate.
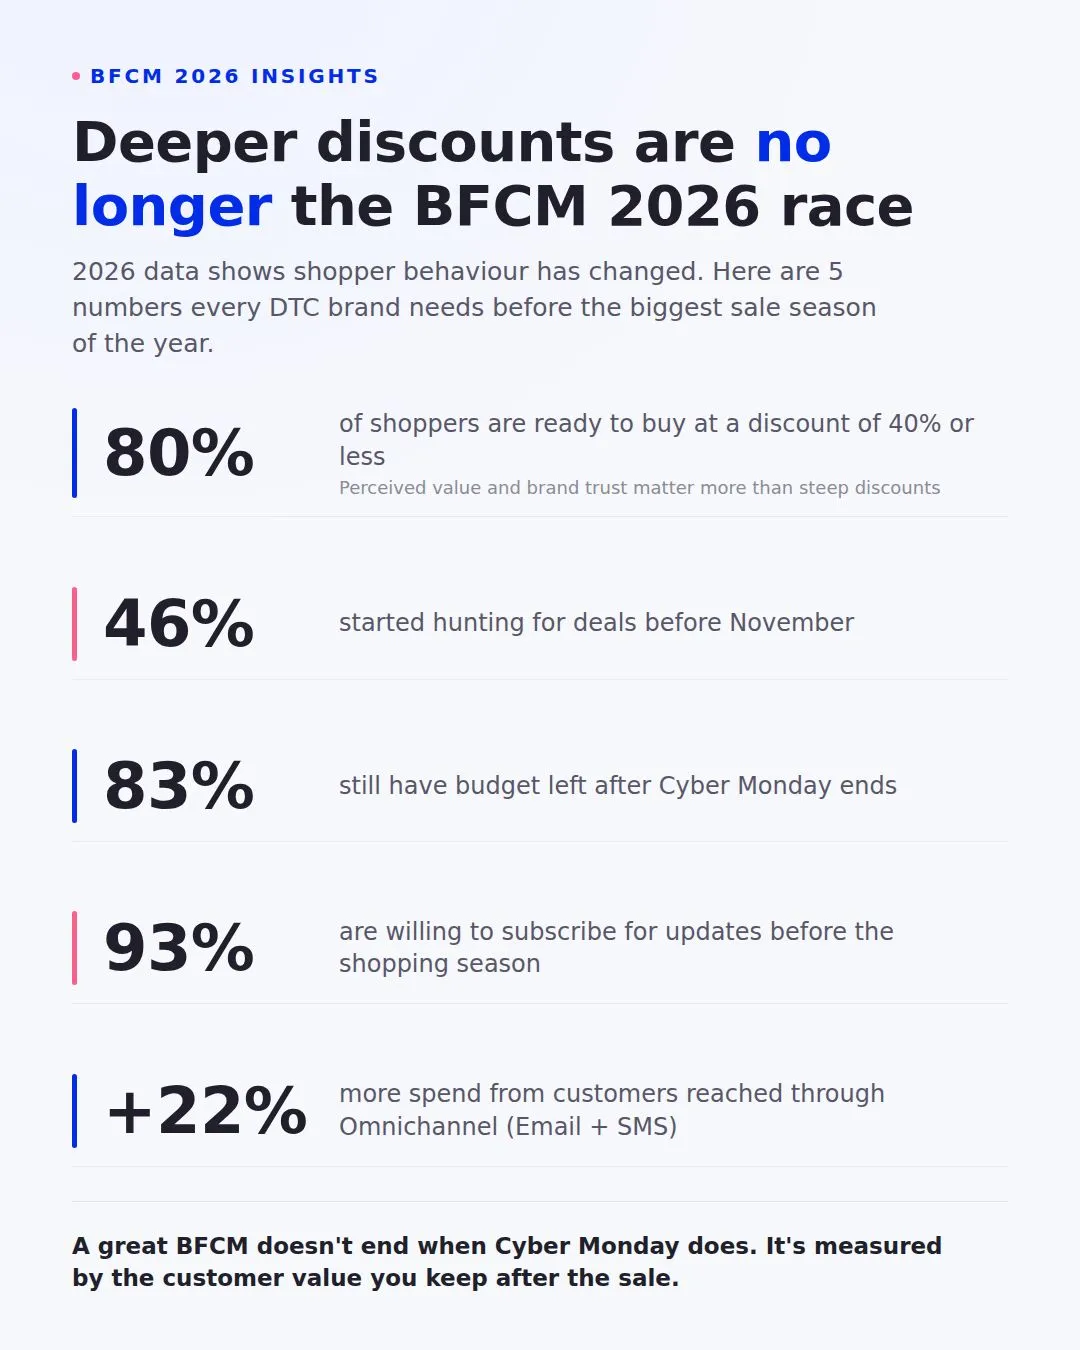
The self-reported tier, and why it is not the same as false
A large share of the thirty-eight are single-operator or single-agency results: an agency's portfolio spend and attributed revenue, a head of creative's Meta screenshots with the brand redacted, a brand's post-purchase revenue after switching tools. They were not dropped for being implausible, but because there is no public artefact to check them against — and often because they carry a contradiction the poster did not notice. One email agency's headline says "73% BFCM revenue growth" while the same post's body and image say +273.3% attributed and the store itself grew 64.3%. One CRO agency's per-tactic uplift table appears with 2,500 tests in one post and 4,000+ in another, €7.8M of Black Friday wins in one and €500M+ in another, with the same uplift values recycled across unrelated brand teardowns.
Named, self-reported, unverified is a real evidence tier and a useful one: it tells you what a competent operator believes worked. It is not a benchmark, and it should never appear in a chart, because a chart strips the attribution off and leaves the digits standing alone.
The corrections that went the other way
Checking is not only subtraction. Klaviyo's average BFCM discount of 26.2% circulated as "a 10% drop" with no word on points or percent; the primary page settles it — 29.1% in 2024 to 26.2% in 2025, a 10% relative decline, 2.9 points. The "15–34% cheaper in Halloween week" ad-cost figure was credited to a Shopify agency that never published it; it is Strike Social's, and it is usable once correctly attributed. Bain's "additional 13%" for retailer-owned AI agents turned out to be exactly what Bain wrote, settling a dispute between two posts that each thought the other had misread it.
Ninety seconds per claim
Four questions catch nearly everything above. Who measured it — the company whose name is on the number, or someone retelling it? Over what period — forecast, mid-season read, or final? Who is in the denominator — all shoppers, or only those who already do the thing being measured? Is the comparison stated — up from what, against whom, points or percent?
A claim that answers all four can still be wrong, but it can be argued with. A claim that answers none is not evidence, however often it has been reshared.
Handle with care
Three number families here are quoted constantly and none survived: BFCM CPM inflation as stated by practitioners ("+30–50% in November", "+50–100% in peak week" — mutually inconsistent, no cohort or vertical named); the share of BFCM buyers who never return (50%, 73%, 81%, 92%, all from vendors and individuals with no named dataset); and post-BFCM chargeback economics (1–2% of revenue, $240 per $100, $125B a year — all from sponsored posts by one vendor). Each describes a real problem. None gives you a number to plan with.
Chapter 13
The operator's plan: T-12 to T+6
Black Friday 2026 is Friday 27 November; Cyber Monday is Monday 30 November, back in November for the first time since 2023. T-12 weeks is the week of 4 September; T+6 is the week of 5 January. Every row below has an owner and a gate — the observable condition that means it is actually done, not started. Rows marked HARD DATE are set by someone other than you.
Lift this straight into a tracker. Owners are roles, not people: merch (merchandising and offer), lifecycle (email, SMS, retention), paid (media buying and measurement), ops (inventory, fulfilment, CX, marketplaces), dev (storefront, apps, data), finance. A gate you cannot read off a screen is not a gate.
| Week | Task | Owner | Gate — how you know it is done |
|---|---|---|---|
| T-12 4–10 Sep | Lock the offer and the budget. Nothing downstream is briefed until both are signed. | merch + finance | One written offer doc with discount, exclusions, start/end timestamps and budget, signed off. No open questions. |
| T-12 4–10 Sep | Model contribution margin and break-even volume per SKU band: discount + free shipping + GWP + loyalty + CAC + fulfilment. | finance | Volume multiple computed per band using margin ÷ (margin − discount). At 60% margin a 30% discount needs 2x volume, a 40% discount needs 3x. Ring-fenced SKUs listed by name. |
| T-12 4–10 Sep HARD DATE | Pull TikTok Shop US fulfilment metrics. Policy effective 3 September 2026. | ops | Valid Tracking Rate ≥95%, On-Time Delivery Rate ≥80%, Late Dispatch Rate ≤4% (enforcement above 10%), Seller-Fault Cancellation Rate ≤2.5%, each read from Seller Center and screenshotted with a date. |
| T-12 4–10 Sep | Pull last year's data: which deals drove revenue, where traffic came from, which emails worked, what fell flat. | merch + paid | A one-page prior-year readout exists, with the Q4 revenue goal and Black Friday's expected contribution stated as numbers. |
| T-11 11–17 Sep | Size the Q4 stock order: 8-week run rate, YoY growth, peak weeks weighted separately, lead time covered, capped against cash. | ops + finance | PO issued and confirmed in writing by the supplier, with a stated on-water date. Hero-SKU revenue concentration written down. |
| T-11 11–17 Sep | Start offer-based creative testing. Winners go into a BFCM folder for reuse in November with adjusted copy. | paid | At least three offer-led concepts have run and been read; the BFCM folder exists and is not empty. |
| T-11 11–17 Sep | Run 24-hour micro-tests of candidate offer types on random days between 1 Sep and 1 Nov; compare on profit, then stop. | merch + paid | Each candidate offer has one full test day logged with revenue, CVR and margin. Winner locked; a contingency offer chosen. |
| T-10 18–24 Sep | Set and publish the change-freeze date for theme, apps, checkout and speed. | dev | Date is in the shared calendar with a named override authority. Everyone who ships has acknowledged it. |
| T-10 18–24 Sep | Record a dated 30-day baseline for conversion rate, AOV and revenue per visitor before anything changes. | dev + paid | Baseline saved with its date and segment definitions, outside the analytics tool that will be modified. |
| T-10 18–24 Sep | Speed work on product and category pages. | dev | Under 3 seconds on a real phone on mobile data, not a lab score, measured on your three highest-traffic templates. |
| T-9 25 Sep–1 Oct HARD DATE | Amazon US Business Hour Delivery Rate requirement for seller-fulfilled shipments to Business customers begins 30 September 2026. | ops | BHDR ≥90% on the rolling 14-day window. Below it you get a notification on 30 September and risk FBM deactivation for Business customers from 30 October. |
| T-9 25 Sep–1 Oct | Load-test checkout and the storefront. | dev | Passes at 5–10x normal traffic with auto-scaling on and a payment failover path exercised, not just configured. |
| T-9 25 Sep–1 Oct | Test the stock feed under load and on-site search. | dev + ops | Feed stays accurate at peak query volume; the top 50 search terms all return a relevant first result. |
| T-9 25 Sep–1 Oct | Deliverability: authenticate and clean before volume rises. | lifecycle | SPF, DKIM and DMARC all passing. Hard bounces, bots, spam traps and misspelled addresses removed. Bounce rate under 1%. |
| T-8 2–8 Oct | Begin layered list warm-up: 30-day engaged, then 60, then 90, then 120–180 through October and November. | lifecycle | Volume rises in layers with spam complaints under 0.1% in Postmaster Tools and unsubscribes under 0.3% at every step. No single jump that wakes the whole list. |
| T-8 2–8 Oct | Clean the knowledge base and start training the CX agent. Vendors quote two to three weeks. | ops | Agent answers the top 20 real tickets correctly in staging, and escalation rules to a human are written down and tested. |
| T-8 2–8 Oct | Pressure-test the seams: order-to-cash, inventory accuracy, ERP and order routing across markets. | dev + ops | A test order completes end to end in every market, including tax, duties and the return path. |
| T-7 9–15 Oct | Add redundancy: backup processors, three to five standby ad accounts with spend history, a promo domain separate from evergreen, backup product pages. | dev + paid | Each backup has been used at least once for a real transaction or a real spend, not merely created. |
| T-7 9–15 Oct | Rework every flow for the sale: welcome leads with the offer; cart and checkout retimed from 1h/4h/24h to 15min/2h/6h; universal BFCM banner across active flow emails. | lifecycle | Every active flow previewed with the sale version live, and scheduled to switch on and off automatically on the offer's timestamps. |
| T-6 16–22 Oct HARD DATE | Change freeze begins. No new app installs inside 30 days of the sale; no theme swaps, checkout changes or homepage redesigns. | dev | Freeze is live. Anything shipped after this needs the named override authority and a before/after speed and CVR reading. |
| T-6 16–22 Oct | Build and publish BFCM category and landing pages so they index before the sale. | merch + dev | Pages live, indexed, and reachable from navigation. Key categories pulled out of filter dropdowns. |
| T-6 16–22 Oct | Merchandising month: gift guides, collections, product data, creative. | merch | Every hero SKU has delivery dates, returns information and an alternative shown for sold-out variants. |
| T-5 23–29 Oct | Re-engage lapsed buyers before inbox competition peaks. | lifecycle | Winback send has gone out and its complaint rate is inside the deliverability gates above. |
| T-5 23–29 Oct | Send creator and affiliate samples. Not during the sale. | merch | Samples delivered 2–3 weeks before BFCM, with briefs, codes, links and deadlines in one shared place. |
| T-5 23–29 Oct | Swap the evergreen popup and discount codes for sale-offer versions. | lifecycle | No path exists to stack an evergreen 10% on top of the sitewide offer. Dead codes deactivated and tested. |
| T-4 30 Oct–5 Nov | Seed volume to get campaigns out of the learning phase while media is cheaper; do not go quiet in the Halloween-to-Black-Friday gap. | paid | Every campaign that will carry peak budget is out of learning, with a stable cost per result for at least five days. |
| T-4 30 Oct–5 Nov | Open VIP and early-access opt-in. | lifecycle | Segment is populating daily and has its own send path separate from the public calendar. |
| T-4 30 Oct–5 Nov | Ship the offer's site furniture: homepage hero, announcement bar, collection banners, PDP modules, cart logic. | merch + dev | Every surface states the same offer and the same end time, checked on a phone at 390px as well as desktop. |
| T-3 6–12 Nov | Confirm 3PL and warehouse capacity, packaging and shipping supplies. | ops | Written confirmation at 2x and at 10x normal volume, with an agreed plan if you exceed it. |
| T-3 6–12 Nov | Publish December shipping cutoff dates against real carrier capacity. | ops | Dates are on the site and in email templates, and the fulfilment team has agreed they are achievable. |
| T-2 13–19 Nov | Plan around Amazon's deal window, which opens roughly 12 days before Cyber Monday. | merch + paid | Your own sale open date is set relative to it, not discovered afterwards. |
| T-1 20–26 Nov | Write the war-room rules, about ten days out. | paid + ops | One document naming who watches spend, who approves a move, the action thresholds (for example CPA up 20%), the hourly pacing sheet, and the single channel where decisions are logged. |
| T-1 20–26 Nov | Run VIP early access 24–48 hours before the public launch. | lifecycle | VIP send completed, revenue read, and the public launch unchanged as a result. |
| T-0 26–30 Nov | Trade the plan. Do not change the offer once it is live; keep proven evergreen ads running with banners and countdowns added. | all | Change log shows one or two moves per cycle, each with a reason. Offer terms unchanged from the signed doc. |
| T-0 26–30 Nov | Daily checks: stock, offer integrity, flows, deliverability, spend pacing; exclude recent purchasers from "last chance" sends. | lifecycle + ops | Checklist completed and initialled each morning. ESP outage plan and backup send path confirmed working. |
| T+1 1–7 Dec | Do not go dark. Run the post-purchase sequence for first-time BFCM buyers: onboarding, education, then a reason to return. | lifecycle | BFCM buyers are tagged in their own segment and are receiving a sequence distinct from the evergreen welcome. |
| T+2 to T+3 8–21 Dec | Sell into Green Monday and the shipping deadlines without deepening the discount; budget for the cost peak 7–10 days before Christmas Eve, roughly 14–17 December 2026. | paid + merch | December budget is set against the expected CPM curve rather than November's, and gift-card flows are live for after the cutoff. |
| T+4 22–28 Dec | Staff 26–31 December as a second operational peak. Roughly one in seven of the season's returns lands in those six days. | ops | Warehouse and CX cover booked and confirmed in October, not arranged that week. |
| T+4 to T+6 26 Dec–11 Jan | Run the Q5 plan you wrote in October: creative shifts from gifting to self, retarget holiday traffic, convert gift-card redeemers. | paid + lifecycle | Campaigns launched from a pre-written brief on 26 December. Nothing improvised. |
| T+5 29 Dec–4 Jan | Process the returns wave: link every return to its original order and customs record, decide who owns the return declaration, inspect fast enough to resell at full value. | ops | Return-to-order linkage working for every channel, and resellable stock back on sale within the agreed turnaround. |
| T+6 5–11 Jan | Reconcile BFCM net revenue after returns with the full cost stack before anyone reports a result. | finance | A single net number exists including COGS, freight, 3PL, fees, discounts, agency, revenue shares and tool creep. Gross number is not quoted anywhere. |
| T+6 and on from 5 Jan | Reserve against disputes, which arrive 30 to 90 days after the sale, and check CAC against LTV on the Q4 cohort. | finance | Reserve sized from your own processor's dispute rate, not a vendor statistic. Share of the cohort that is one-and-done is written down. |
What ShopX will put on stage
These are the questions this evidence raises that no report can answer. They are written to be hard to answer with a slide.
- Adobe recorded a record US online holiday season, but Black Friday order volume fell 1% while average selling price rose 7%. When a founder says "we grew 20% last BFCM", what should they check before celebrating?
- McKinsey has 45% of US consumers starting by the end of October and only 12% waiting for Black Friday weekend. So in 2026: do you tease early and sell late, or open the sale in the first week of November? What did you do last year, and what changed?
- Show us your margin math. At what discount depth does your offer stop being worth running, and which SKUs do you refuse to discount at any depth?
- Which operational number is closest to locking you out of BFCM right now — a delivery rate, a cancellation rate, an account-health score — and who inside your company owns it?
- What is on your do-not-touch list after the freeze date, and who is allowed to override it? How do you tell a worthwhile exception from the app install that halves your conversion rate?
- A survey of 180 European e-commerce companies found 30% changed no prices at all during Black Week and 74% reported a real barrier to reacting mid-week. What is your team's actual mechanism for changing a price on Saturday at noon, and who approves it?
- Conversion windows stretch during Cyber 5, so early-November spend looks bad at the midpoint. What is your read cadence, and what would make you cut a campaign on day two?
- Your AI agent can publish ads or shift budgets. Where exactly is the approval gate at 2 a.m. on Black Friday, and who gets paged when it acts on bad data?
- Klaviyo credits AI recommendations with 71% year-over-year revenue growth; Meta reports 1–3.5% gains from its own models. How should a head of ecommerce reconcile modest platform-reported lifts with 10x vendor claims — and how do you vet a case study whose numbers come from paid partners?
- One in seven holiday returns now lands between 26 and 31 December, disputes arrive 30 to 90 days later, and 79% of shoppers with a bad returns experience do not come back. What does your January plan look like, and how does it change the offer you run in November?
What to do about it
Put the freeze date in the calendar this week
One date covering theme, apps, checkout and speed, with one named override authority. Everything structural lands before it or waits until January.
Compute break-even volume before you pick a discount
Volume multiple needed = original margin ÷ (original margin − discount). Run it per SKU band and ring-fence the products that cannot absorb the cut.
Pull your marketplace compliance numbers today
Delivery rate, cancellation rate, dispatch rate, account health. These gate eligibility, they are set by someone else, and none of them can be fixed in November.
Reserve part of the BFCM budget for December and January
Decide the amount now, before the weekend spends it. The second purchase is where a peak-CAC cohort becomes profitable.
Give every row in your own tracker a gate
If the "done" condition cannot be read off a screen — a rate, a threshold, a completed test order — it will be marked done while still broken.
Chapter 14
Five workflows, start to finish
Chapter 13 says what to do and when. This one shows five jobs end to end: the trigger, the order of operations, who owns each step, the tools operators named, what it returned, and the specific way it breaks. Numbers belonging to the person reporting them are labelled as such.
1. The BFCM email and SMS calendar
Trigger. The offer is locked at T-11, leaving eight weeks to raise send volume on a list you cannot safely wake in November.
- Lifecycle, September. Authenticate SPF, DKIM and DMARC; remove hard bounces, bots, spam traps and misspelled addresses. Then warm in engaged layers through October and November — 30-day, then 60, 90, 120–180 — rather than jumping from 100,000 sends to the whole list overnight.
- Lifecycle, T-7. Rework the flows rather than writing new ones: welcome leads with the BFCM offer; cart and checkout retimed from 1h/4h/24h to 15min/2h/6h; one universal BFCM banner across every active flow email, scheduled to switch itself on and off with the offer.
- Lifecycle + merch, T-6. Build the segments — VIPs, last year's Black Friday buyers, engaged non-buyers, lapsed, and a suppression list — and exclude recent purchasers from every "last chance" send.
- Lifecycle, T-5. Replace the evergreen popup so a standing 10% cannot stack on a 30% sitewide offer. Write the post-BFCM plan in the same week; it will not get written in December.
Tools named: Klaviyo, Omnisend, Alia (popups).
What it returns. Omnisend's BFCM data shows automated messages were about 3% of email sends but roughly 30% of all email orders. Klaviyo's BFCM 2025 figures show multichannel shoppers — email plus SMS or RCS — viewed 71% more products, added 34% more to cart and placed 11% more orders than single-channel shoppers, with repeat-buyer revenue growing 13.5% against 9% from new buyers. Both platform-reported.
The live argument, both sides named. Rabah Rahil, CMO at Tie, argues for breadth: "Somehow email is the only channel where sending less to everyone gets called a strategy. Anywhere else we'd call that a retreat" — send wide, then cut the profiles that never convert. Against him, Klaviyo's own recap positions its BFCM winners as brands that were not sending more. Neither has a controlled test; both agree the pruning happens in September.
Failure mode. A burned sender reputation, which you cannot buy back inside the season. The figure everyone quotes — 14 to 16 weeks to recover with Gmail — is a named agency estimate (Mariel Bacci Kilroy of Sticky Digital, relayed by Rahil), self-reported and not traceable to any Google source. Use guardrails instead: Chronos Agency runs to spam complaints under 0.01%, unsubscribes under 0.3% and bounces under 1%, against Gmail's published rule of 0.3% per send.
2. Deploying an AI support agent before peak
Trigger. Ticket volume rises faster than headcount. The claim that queries triple at BFCM comes from a vendor CEO and could not be verified; the direction is not disputed.
- Ops + dev, T-10. Clean the knowledge base before pointing anything at it — every customer-facing AI failure here was a data failure first — then connect order status, tracking and live stock and test those connections at agent query volume, not demo volume.
- Ops, T-8. Train. Vendors quote two to three weeks; CX leads here say start in August.
- Ops, T-7. Roll out in phases — foundation, scale, quality control — writing the human handoff rules before go-live, not after the first escalation.
- Ops, weekly from T-6. Report containment, resolution and CSAT against the pre-switch baseline. Volume handled is not a result.
Tools named: AfterShip Intelligence, Sierra, Gorgias AI Agent, Siena AI, Kustomer, Agentforce 360, ZipChat, Envive.
What it returned, periods kept straight. Digital Commerce 360 reported on 2 September 2026 that Dr. Squatch, using AfterShip's post-purchase agent, saw 25% fewer "where is my order" tickets, 94% on-time delivery-date accuracy and a 31.89% click-through rate on tracking-page recommendations — all three describing Q1 2026. The BFCM-specific figures are a 99.83% delivery-completion rate and shipments up 62.69% month over month through Cyber 5 2025. Sierra published one BFCM number for Minted: conversation volume absorbed up 387% month over month, with no containment, resolution or CSAT rate alongside it. Both vendor-published, single-brand, unaudited.
AI isn't something you can just turn on with the flip of a switch if you want it done right. It takes training and reviewing and managing just like a human.
Zoe Kahn, CEO, Inevitable Agency
Failure mode. Agents recommending out-of-stock products; confident answers from an uncleaned knowledge base; the agent contradicting the rest of the site because no merchandising rule governs it. Narvar's 2026 Holiday Shopping Report — 1,348 consumers, 100 senior retail decision-makers — puts 65% of shoppers planning to use AI somewhere against 8% of retailers "very confident" in using it well.
3. AI-assisted creative production with human QA
Trigger. Peak needs more variants than a human pipeline produces, and delivery systems reward differentiation between them.
- Paid, T-10. Find a reference look in the wild rather than prompting from scratch, and build a reference sheet for character, setting and product. With those locked, a plain-language prompt beats an elaborate one.
- Paid, T-9. Adapt a proven organic script to your product. AI shortens idea-to-ad; it is weak at the idea.
- Paid, T-8. Generate stills, animate, voice, stitch. Tools operators named: Nano Banana, Flux and MiniMax for stills; Veo and Seedance for motion; ElevenLabs for voice; CapCut to assemble. Structure the test before spending: three variations per angle, a seven-day window, kill and scale criteria written first, a weekly fatigue audit.
- Merch + paid, throughout. Human QA: feed brand-voice guidelines and real testimonials first, train on ten to fifteen best-performing assets, then put three review checkpoints in front of anything that ships.
What is verified. The Taboola study with Columbia, Harvard, CMU and TU Munich — 500M+ impressions, 3M+ clicks — found AI-generated visuals reached a 0.76% click-through rate against 0.65% for human ads, and concluded AI ads performed comparably once controls were applied, with no reduction in downstream conversion. That is the whole verified finding: AI creative is not worse. It does not say better.
What is not verified. Every production-cost figure in the category. "347 Black Friday ads in 48 hours, $49 versus $500 a video" was posted in identical wording by two unrelated accounts three months apart — a template, not a measurement. A claimed drop from $100 to under $2 per asset at an unnamed global FMCG traces to an interview nobody could locate. The volume rules of thumb — $10–20 of daily spend per creative, 80–100 assets a month — are unsourced and contradict each other.
The counter-case, self-reported. HexClad cut its asset count from 75 to 25 for one unified creative story across ads, email and site, reporting add-to-cart up 56% and conversion up 23% — a Mother's Day sale presented as transferable to BFCM, on the brand's and agency's own numbers. As Marco, founder of a performance creative agency, puts it: "Double the count without that reasoning, and all you get is more ads to test."
Failure mode. Rejections driven by staged authority claims, character and voice drift across cuts, output that reads as non-native to the feed — and undisclosed synthetic creators behind all three.
4. An incrementality test before the peak
Trigger. Platform-reported ROAS and measured ROAS diverge most when everything is on sale at once.
- Paid, T-12. Test upper-funnel media now, while the Q4 budget is committed and the downside is bounded.
- Paid, T-11. Design for peak: skip holdouts, which take a channel dark in the window that pays for the year, and run two- or three-cell A/B/C tests instead. Re-test brand search specifically; its incrementality moves with seasonality and competition.
- Paid, T-9. Add a post-treatment window running through the sale, and do not cut the test at its midpoint — that is how you manufacture a false negative. Finish by T-6 and reallocate before the freeze.
What the published results say. Haus's 2025 Cyber Week Incrementality Report found brands that ended their test at least three weeks before BFCM saw a +105% post-treatment-window lift, against +75% for tests running closer to the weekend — the version circulating in this corpus had the two groups swapped. Across Haus experiments, delayed lift exceeded immediate lift in 73% of cases and rises 79% in Q4 versus evergreen periods, and pre-BFCM experiments returned on average more than 2x their measured value after the treatment window closed.
What it costs not to test. In Haus experiments, Meta Advantage+ over-reported revenue by 12 percentage points relative to manual campaigns. One unnamed brand spent $5M on Meta for BFCM: the platform reported 4.5x ROAS, a geo-lift test measured 2.7x incremental — roughly $9M of credited sales that would have happened anyway.
Say the obvious thing, then the failure mode. Haus sells incrementality testing, and every finding above makes the case for buying it. That does not make the numbers wrong; it means you copy the experimental design and reproduce the result on your own account rather than adopting the conclusion. The two ways this goes wrong: reading day-one over-efficiency as success, and stopping a test at its midpoint because the interim number looks bad.
5. Getting found by AI assistants
Trigger. On 10 July 2026, the share of ChatGPT Shopping recommendations sourced from connected product feeds jumped from 8.26% to 61.54%, across 1,757,723 tracked prompt runs that month. Whether your catalog is machine-readable stopped being a 2027 problem that day.
- Dev, T-12. Submit and maintain a product feed — the single change with an observed effect.
- Merch, T-11. Complete the attributes — price, availability, GTIN, shipping and returns terms. Missing fields are silent disqualifications.
- Dev + ops, T-10. Keep stock sync accurate at agent query volume, the same test as workflow 2. Make product pages answerable on fit, materials and compatibility.
- Paid, T-8. Instrument the referrals: list every AI referrer visible in analytics, check how each is classified, re-check after each platform release.
What changed for whom. The shift concentrated the field: top-ten store share rose from 22.5% to 41.8%, unique merchants referenced fell from 13,524 to 10,607 (−21.6%), and of 687 tracked stores 517 saw visibility swings of 33% or more, 450 of them downward. ReFiBuy's AI1000 index separately found 972 of 1,000 retailers changed rank in Q2 2026, median move 35 places, with only 10 of the 100 largest online retailers by sales in its top 100. Visibility here is neither proportional to size nor stable.
Conversational Shopping is (still) a merchandising problem, not an LLM problem as most vendors would want you to believe.
Vinod Kumar, CEO of Synth, who built YETI's Ranger assistant
Failure mode. There is no error message. A feed defect or missing attribute removes you from consideration silently, and the measurement layer cannot tell you: PYMNTS Intelligence, in a merchant survey commissioned by Visa Acceptance Solutions, found only 23% of merchants can identify both AI-driven traffic and the purchases that follow, with another 21% seeing the traffic and unable to connect it to an order. Until that closes, treat this as insurance on a channel you cannot price: worth doing because the work is cheap and catalog hygiene pays elsewhere, not because anyone can show you the return.
Method
Method and evidence ledger
Chapter 00 says what this report is. This one says exactly how each number got here, what the checking could and could not establish, and then lists every printable figure with its measurer, period, status and a link.
Collection and screening
Posts were collected from LinkedIn and X across BFCM planning, offers and discounting, operations and fulfilment, email and SMS, paid media and creative, AI tooling, and AI-assisted shopping. No keyword filter decided what stayed. Every post was scored by Claude on four questions: is it substantively about running a BFCM, does it carry a concrete tactic, case or number, is it an empty pitch or engagement bait, and which commercial surface does it belong to. That set 3,675 aside and kept 1,000.
Images attached to kept posts were opened and classified one at a time — 735 of them. Charts whose labels contradicted their own plotted values were rejected, as were mockups presented as screenshots and graphics whose stated sources could not be reconciled with the numbers printed on them. Of those reviewed, 223 reached a shortlist and 79 were rated strong enough to reproduce.
Checking
Every number in the kept posts was extracted with its claimed source, period, population and baseline, then consolidated: the same figure repeated by forty accounts is one piece of evidence, not forty. That produced 311 distinct claims. Each was then chased to whoever published it first — a press release, an SEC filing, a platform policy page, an earnings-call transcript, a survey methodology, an arXiv paper — until a primary or near-primary document either confirmed it, contradicted it, or could not be found. 210 were resolved that way.
The outcomes are labelled through the report and in the table below:
- First-party / research the figure was confirmed verbatim in the measurer's own document.
- Named, secondhand the measurer is named and the figure was confirmed through reputable reporting of that measurer, but their own page could not be retrieved, or the circulating version was wrong and the corrected value is printed instead.
- Weak source the number is real but the caveat has to travel with it: a narrower population than the headline implies, stated intent rather than measured behaviour, a vendor's interest in the finding, or a definition broader than it sounds.
Thirty-eight claims failed outright. They are not quietly omitted: Chapter 12 names them and groups them into the eight patterns that produced them, because those patterns will produce next year's crop too.
What this method cannot tell you
- It measures what operators published, not what they did. The corpus over-represents people whose job includes posting. A store that had a quiet, profitable BFCM and said nothing about it is invisible here.
- It cannot audit a first-party disclosure. When Meta says its ranking model lifted clicks 3.5%, or Klaviyo reports $3.8 billion in attributed value, this report records who said it, when, and what it compares. It cannot check the arithmetic behind it.
- A confirmed number is not a transferable number. Adobe, Shopify, Klaviyo, Salesforce and Stripe each measure a different population with a different method. None of them measures your store, and their figures are not additive.
- Absence of a source is not proof of falsehood. Several dropped claims are probably true and simply live in a podcast, a slide or a private dashboard. They are dropped because you cannot plan against something you cannot check, not because the person is lying.
- It is a snapshot with a short half-life. The ChatGPT feed shift is eight weeks old at publication; the marketplace thresholds take effect during it. Several findings here will be stale before BFCM 2026 ends.
- One reviewer, one pass. Screening, extraction, checking and writing were done by Claude under the rules above, with the outputs traced back to source documents. A second independent pass would catch things this one missed.
The ledger
Every number printed anywhere in this report, with the organisation that measured it, the date of the source document, its status after checking, and a link. Claims marked Corrected are ones where the circulating version was wrong and the value shown here is the one the primary source actually gives. Claims marked Needs context are usable only with the caveat stated in their notes.